How to write IELTS Writing Task 1 Line Graph/ Graph with a trend
IELTS Writing Task 1 frequently presents "trend analysis" – examining changes across time periods. Test-takers encounter various graph formats including tables, bar charts, line graphs, and pie charts. The challenge lies in analyzing trending data efficiently while maintaining accuracy and achieving target band scores. PREP provides comprehensive guidance for handling line graphs and trending data in IELTS Writing Task 1. This strategic framework enables efficient analysis while maximizing scoring potential across all assessment criteria.
I. Overview of IELTS Writing Task 1 Line Graph/ Graph with a trend
1. What is IELTS Writing Task 1 Line Graph/ Graph with a trend?
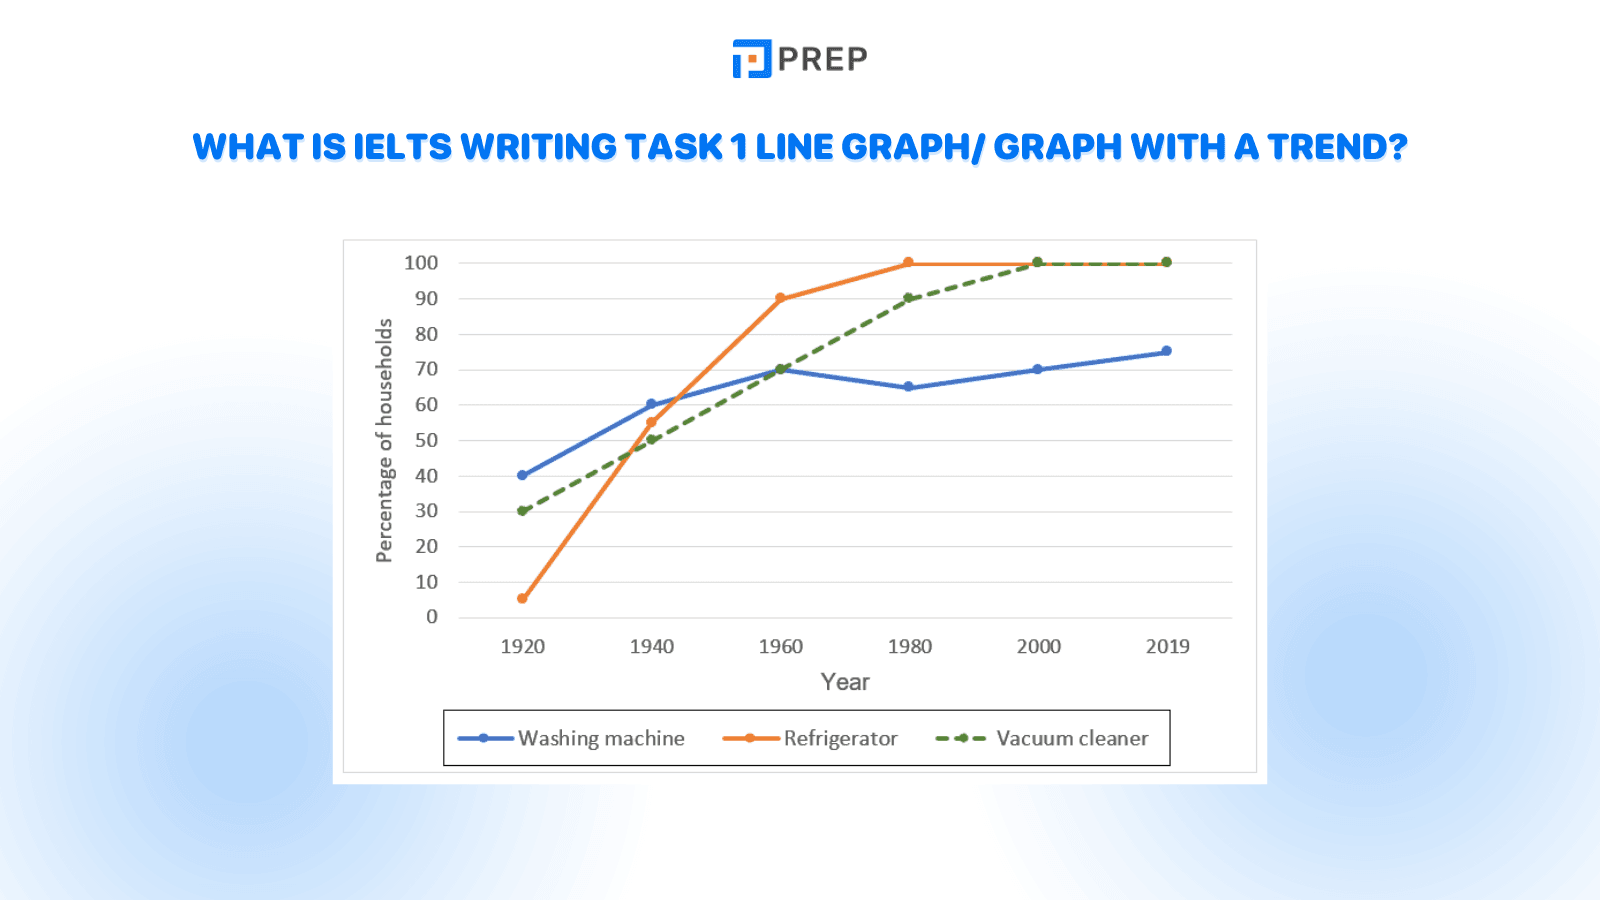
IELTS Writing Task 1 Line Graph/ Graph with a trend task involves charts that include a time element, most notably line graphs (each line represents the changes of an object over a period). Additionally, the Graph with a trend task can also include other types of charts with data from different time points. The writer needs to identify the overall trend and analyze the changes in each stage. Below is an example of a line graph in the IELTS Writing test:
-
Example 1: The charts below show the changes in ownership of electrical appliances and amount of time spent doing housework in households in one country between 1920 and 2019.
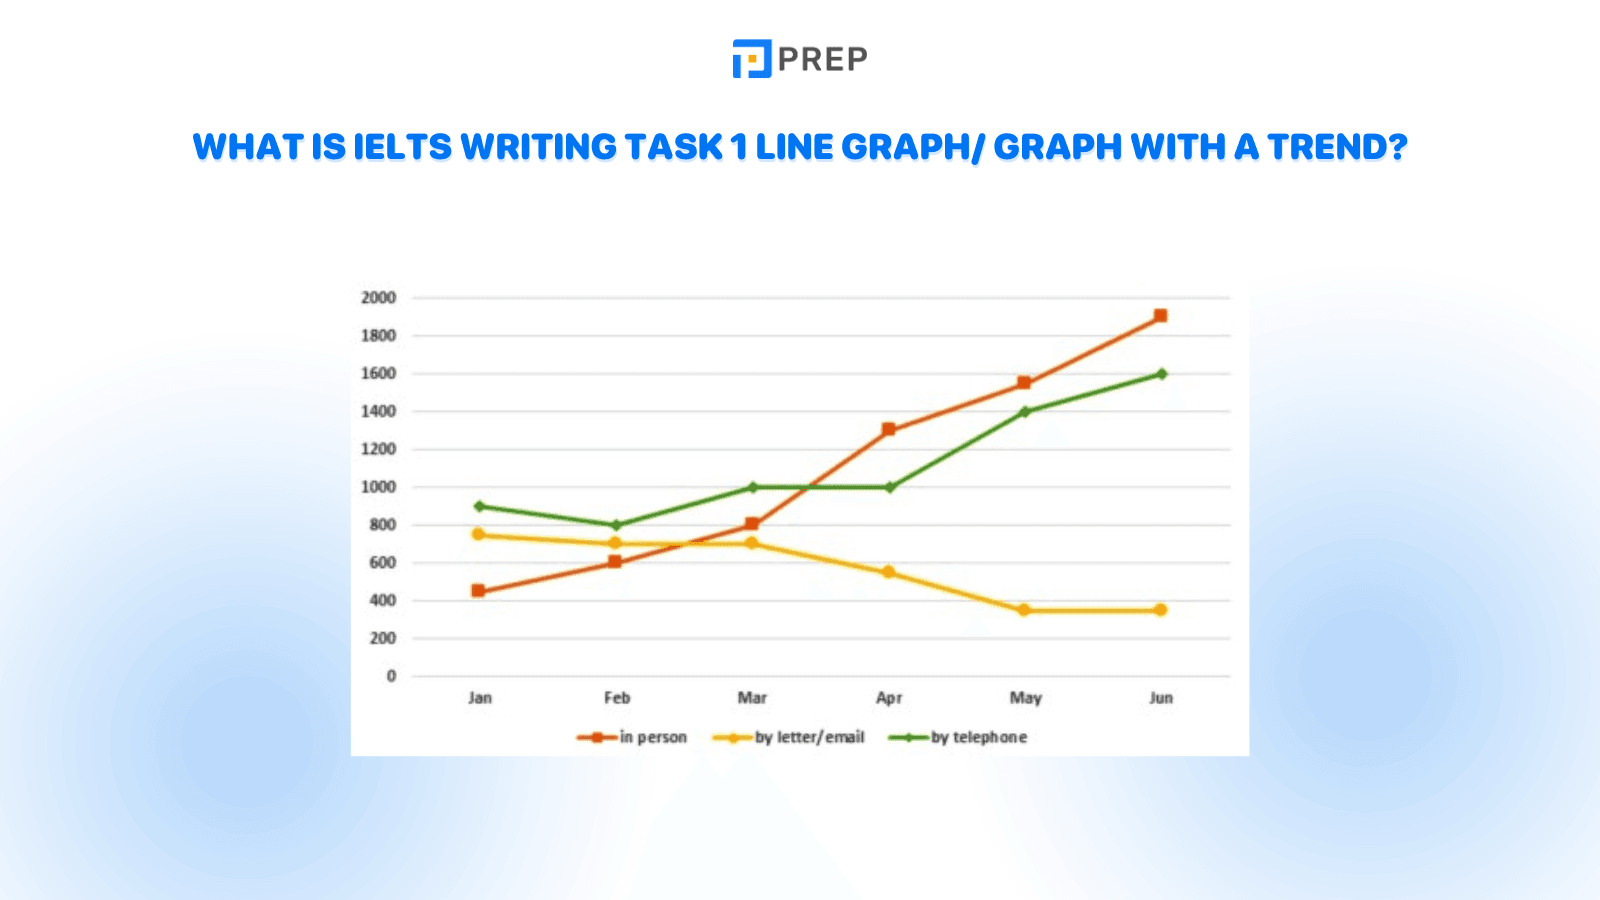
- Example 2: The graph below shows the number of enquiries received by the Tourist Information Office in one city over six months in 2011. Summarise the information by selecting and reporting the main features and making comparisons where relevant.
2. Vocabulary for IELTS Writing Task 1 Line Graph/ Graph with a trend
To effectively present an IELTS Writing Task 1 Line Graph/ Graph with a trend, you need to use scoring English vocabulary. Here are some key vocabulary words:
-
To show an upward/downward trend
-
To witness/see/experience/… a sharp increase/decrease
-
To remain stable >< To vary significantly
-
To steeply rise >< To gently/gradually increase
-
To hit the lowest/highest point of
II. Outline for Graph with a Trend
To achieve a high band score in IELTS Writing, creating an outline before writing is crucial. Here is an effective outline for IELTS Writing Task 1 - Line Graph:
|
III. Sample Essay for Graph with a Trend in IELTS Writing Task 1
1. A sample prompt of IELTS Writing Task 1
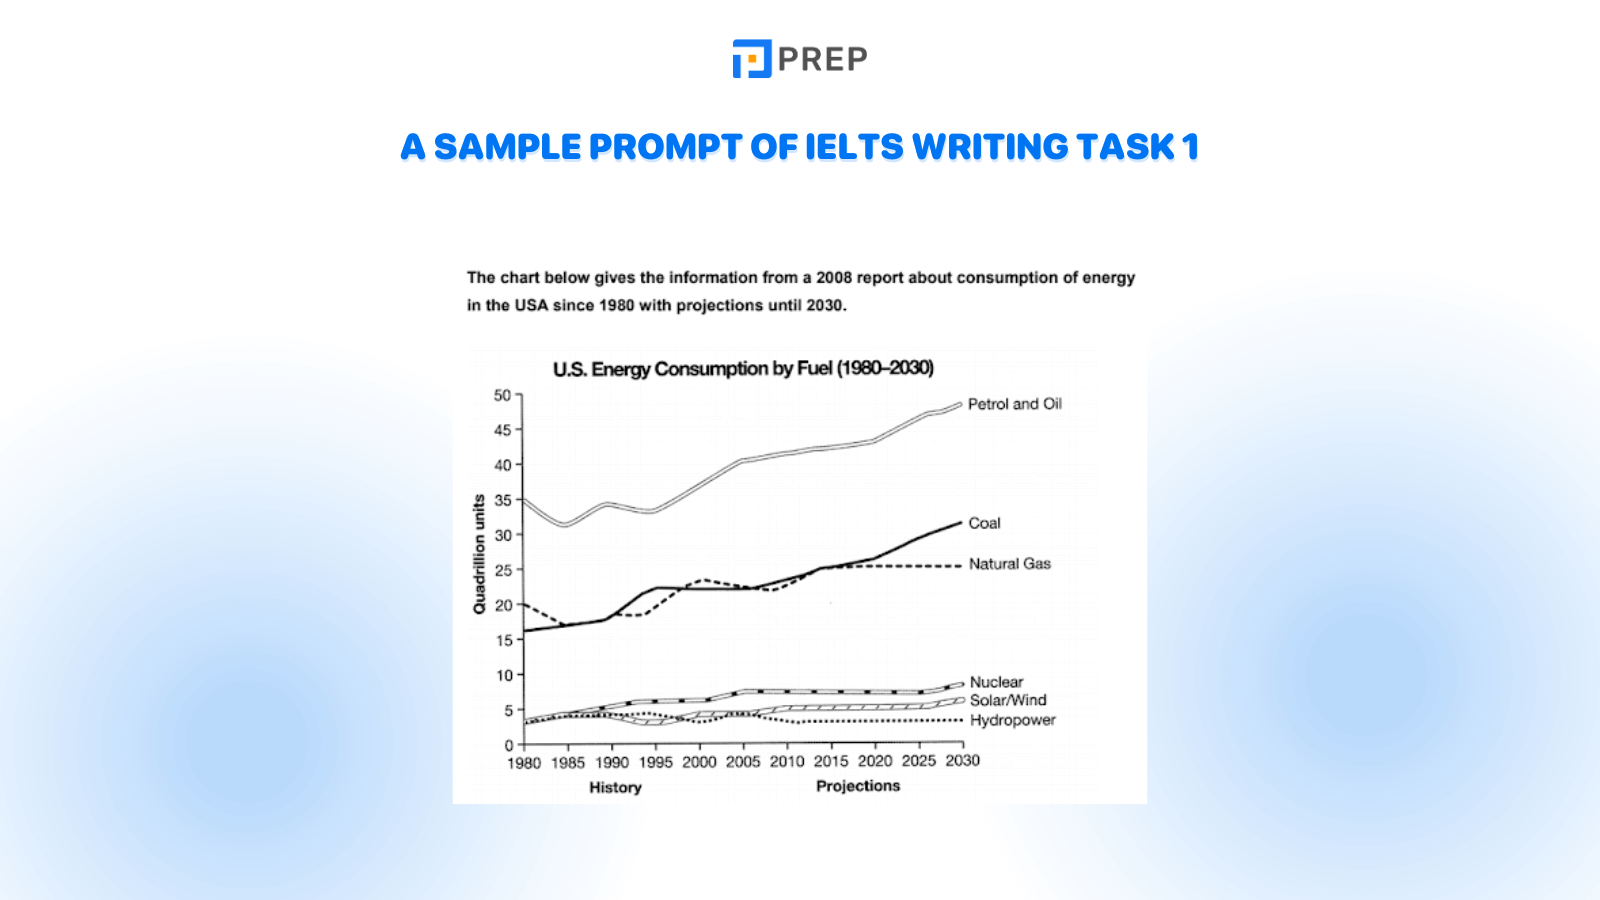
The chart below gives information from a 2008 report about the consumption of energy in the USA since 1980 with projections until 2030. Summarise the information by selecting and reporting the main features and make comparisons where relevant.
2. A sample essay of IELTS Writing Task 1
The chart describes U.S. energy consumption by different sources from 1980 to 2008 and the expected changes until 2030.
Overall, Petrol and Oil and Coal have constantly been rising and will continue to grow further in the future. Meanwhile, energy from Natural Gas, Nuclear, Solar/Wind, and Hydropower will essentially remain constant.
In 1980, the U.S. consumed 35 quadrillion units of energy from Petrol and Oil. This number was significantly higher than any other source and about twice as much as the following two sources: Coal and Natural Gas. There were a few dips over the coming years, but, in general, the demand for petrol and oil quickly recovered and rose constantly. It is anticipated that by 2030, Americans will use almost 50 quadrillion units of energy from this source, still far more than the remaining types of fuel. Similarly, Coal also saw a continuous rise from 15 quadrillion units in 1980 to a projected figure of 30 quadrillion units in 2030, surpassing Natural Gas along the way to become the second most used source.
The remaining energy sources saw little change from 1980 to 2008 and are all expected to remain stable for the rest of the period. Natural Gas started at 20 quadrillion units, and after experiencing slight fluctuations between 1985 and 2015, the number is projected to stay flat at 25 quadrillion units. Nuclear, Wind/Solar, and Hydropower, which have the lowest figures, witnessed virtually no change, each with around 4 to 6 quadrillion units throughout the entire period.
IV. Achieve Band 7+ and Beyond
This comprehensive guide has delivered essential strategies and practical examples for mastering IELTS Writing Task 1 Line Graph compositions, equipping you with the foundation to confidently tackle trend-based visual data and secure impressive scores. By implementing these proven techniques, you maximize efficiency during the writing test, allowing precious time to craft an outstanding Task 2 response. For ambitious test-takers targeting Band 7 and beyond, PREP's advanced resources provide the specialized training necessary to transform competent writing into exceptional performance that unlocks your academic potential:
-
IELTS online course: Break Barriers, Achieve Band 7

Hi I'm Chloe, and I am currently serving as an Product Content Administrator at Prep Education. With over five years of experience in independent online IELTS study and exam preparation, I am confident in my ability to support learners in achieving their highest possible scores.
Comment

Premium content
View all


Personalized roadmap


Most read


UEN: 202227322W
Address: 114 LAVENDER STREET, #11-83 CT HUB 2, SINGAPORE (338729)

