IELTS Writing Task 1: Comparative Graphs Guide
This guide explains how to handle IELTS Writing Task 1 comparative graphs effectively. You will learn how to identify key features, write a strong overview, organize body paragraphs logically, and use accurate comparison language to improve your band score.
Keynote – Task 1 Quick Guide
Direct Answer: In comparative graphs, focus on highlighting significant differences and similarities between groups, rather than describing each figure separately.
Key Points to Remember:
-
Identify and describe major trends and noticeable comparisons
-
Use the standard 4-part structure: Introduction, Overview, Body 1, Body 2
-
Avoid listing every number; prioritize grouped comparisons
-
Don’t overlook key contrasts or write in a non-logical order
-
Stay objective and concise — overexplaining small details lowers coherence
I. What Is This IELTS Writing Task 1 Question Type?
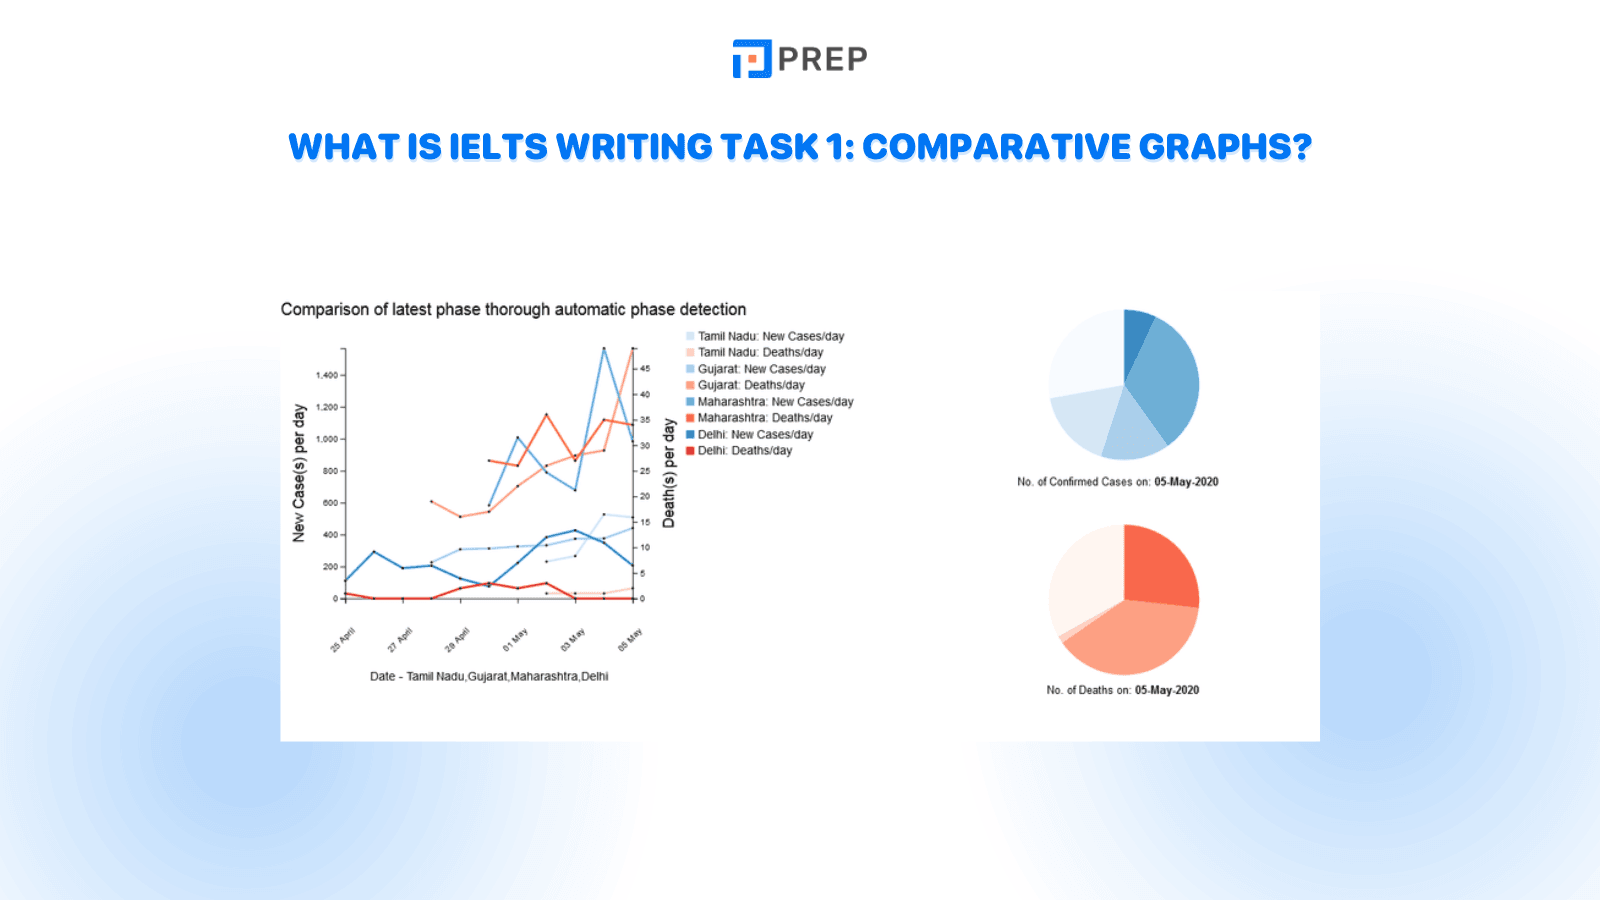
Comparative graphs are a common type of question in IELTS Writing Task 1. They typically show data for two or more groups in a single chart or in a set of mixed charts. In this task, you are required to:
-
Compare and contrast the most important features of the graph
-
Highlight similarities and differences between data groups
-
Describe overall trends, not individual numbers in isolation
Unlike process or map tasks, which focus on describing changes or sequences, comparative graphs center around quantitative relationships. You need to summarize patterns and analyze how data points relate to each other, often across time or categories.
Key elements to identify before writing:
-
Number of groups or categories being compared
-
Type of chart(s) involved: bar chart, line graph, mixed charts, double bar charts, etc.
-
Units of measurement: percentages, millions, dollars, etc.
-
Time frame (if any): Present or past? This determines verb tenses
-
Major trends: Which group increased significantly? Which one remained stable? Are there clear contrasts?
To understand how this task fits into the full exam, you can explore IELTS writing task 1 question types.
II. Recommended Structure for Task 1
To achieve a high band score in IELTS Writing Task 1 with comparative graphs, you need to follow a clear and logical four-part structure. The standard structure includes:
-
Introduction: Paraphrase the task question to introduce the graph
-
Overview: Summarize the main trends or key comparisons without specific data
-
Body Paragraph 1: Describe and compare the first set of significant features
-
Body Paragraph 2: Continue comparing or present less prominent trends and highlights
Organizing your report this way ensures that your answer is well-balanced and your ideas are easy to follow. Each paragraph must serve a clear purpose: the introduction sets up the task, the overview gives the “big picture,” and the body paragraphs break down the details logically and comparably.
For clearer comparisons, see IELTS writing task 1 body paragraph.
1. Sample Essay on IELTS Writing Task 1 – Comparative Graphs
Question:
The chart below shows the number of international students from five countries who enrolled at universities in Australia and the UK in 2015.
Summarise the information by selecting and reporting the main features and make comparisons where relevant.
Sample Answer:
The bar chart compares the number of international students from five different countries who enrolled in universities in Australia and the United Kingdom in 2015. The countries shown are China, India, Malaysia, Vietnam, and Indonesia.
Overall, Australia attracted more students from most of the countries shown, with the exception of China, where the UK had slightly higher enrollment. Chinese students represented the largest group in both countries, while Indonesia and Vietnam had relatively low numbers.
In detail, the number of Chinese students studying in the UK was around 85,000, slightly higher than Australia at approximately 80,000. Indian students, however, showed a reverse pattern, with about 60,000 enrolled in Australia compared to 40,000 in the UK. Malaysia also sent more students to Australia (roughly 30,000) than to the UK (20,000). Similarly, both Vietnam and Indonesia had higher figures for Australia, although the difference was marginal for Indonesia.
In summary, Australia was a more popular destination overall for most of the student groups shown, except for Chinese students, who slightly favored the UK.
Why this essay works well:
-
Introduction paraphrases the prompt accurately
-
Overview summarizes key trends (highest, lowest, overall comparison)
-
Body paragraphs are logically organized by grouping and comparing
-
Vocabulary is precise and well-varied (enrolled, attracted, slightly higher, reverse pattern, marginal)
-
Task response is complete, data selection is relevant, and grammar is controlled
2. Useful Language for This Task Type
When describing comparative graphs in IELTS Writing Task 1, the quality of language you use plays a key role in your score — especially under the Lexical Resource and Grammatical Range criteria.
Vocabulary for Comparison
|
Function |
Useful Phrases |
|
Show difference (A vs B) |
“X was higher than Y” / “X had nearly twice as much as Y” |
|
Show similarity |
“X and Y had similar figures” / “Both X and Y experienced…” |
|
Highlight extremes |
“The highest figure was recorded in…” / “X had the lowest number” |
|
Introduce contrast |
“In contrast,” / “On the other hand,” / “Whereas…” |
|
Express minor differences |
“Slightly more than…” / “Just below…” / “Nearly equal to…” |
Vocabulary for Trends
|
Trend Type |
Useful Verbs / Phrases |
|
Upward trend |
rise, increase, grow, climb, surge |
|
Downward trend |
fall, drop, decline, decrease, shrink |
|
Stability |
remain stable, stay constant, remained unchanged |
|
Fluctuations |
fluctuate, vary slightly, experience minor changes |
|
Rate of change |
grow sharply, increased gradually, dropped dramatically |
Use adverbs and adjectives to modify trends:
-
Sharply, slightly, steadily, significantly, rapidly
-
A sharp rise, a slight decrease, a steady growth
Sentence Structures for Academic Tone
|
Purpose |
Examples |
|
Introducing data |
“The graph shows…” / “According to the chart…” |
|
Describing precise data |
“In 2010, X accounted for 25% of the total.” |
|
Making comparisons |
“Country A had a higher number of X than Country B.” |
|
Making general statements |
“Overall, X tended to increase while Y declined gradually.” |
|
Referring to time periods |
“Over the five-year period…” / “From 2010 to 2015…” |
Style Notes
-
Avoid casual or spoken language like “a lot,” “very big,” or “stuff”
-
Use formal alternatives: “a considerable amount,” “significant growth,” “data” instead of “numbers”
-
Remember: Accuracy > Complexity. Don’t overuse synonyms if you’re unsure of the meaning or grammar.
III. How This Task Type Is Assessed in IELTS Writing
Comparative graphs in IELTS Writing Task 1 are scored according to the same four official band descriptors used in all Writing Task 1 questions. However, this task type places specific demands on your ability to compare data effectively and structure your report logically.
Task Achievement
-
You must clearly identify and describe the most significant similarities and differences between data groups.
-
An effective overview is essential and should summarize the main comparisons or patterns without supporting figures.
-
Avoid listing all data mechanically. Instead, group and prioritize.
-
Penalization may occur if you describe each set of data in isolation, without making relevant comparisons.
Coherence and Cohesion
-
Your writing should follow a clear four-part structure (Introduction, Overview, Body 1, Body 2).
-
Use paragraphing effectively: group related points and avoid overlong or mixed-topic paragraphs.
-
Comparative graphs require linking devices for contrast and comparison: "while," "whereas," "in contrast," "however," "on the other hand."
-
Overusing basic connectives (like “and,” “but,” “also”) or repeating the same format weakens cohesion.
Lexical Resource
-
Use a suitable range of academic vocabulary to describe quantities, trends, and comparisons accurately.
-
You will be assessed on both the variety and precision of your word choices. Avoid using generic words like “good,” “bad,” or “big.”
-
Use appropriate adjectives and adverbs to describe the scale and rate of change (e.g., “slight decline,” “sharply increased”).
-
Avoid repetition: replace “increase” with words like “growth,” “rise,” or “climb” if context allows.
Grammatical Range and Accuracy
-
You must demonstrate the ability to use both simple and complex sentence forms accurately.
-
Comparative forms are essential: “twice as many,” “less than,” “similarly,” “showed a greater increase.”
-
Maintain verb tense accuracy. If the graph shows past data, stick with past simple; if there is no time reference, present simple is appropriate.
-
Errors in subject-verb agreement, singular/plural forms, or punctuation will lower your score.
If you're learning how to describe comparative graphs, you may also want to practice with similar Task 1 formats that involve comparison or multi-source data. These include:
-
Line graphs comparing two or more trends over time. A detailed guide is available in IELTS writing task 1 line graph.
-
Double bar charts showing multiple categories or groups side by side
-
Mixed charts, such as a bar chart plus a table, requiring both data description and comparative analysis
-
Two separate charts in one question, where the comparison involves interpreting relationships across two sources
-
Changes between two time points for the same category (e.g., exports by country in 2010 vs. 2020)
IV. Achieve Your Dream IELTS Band Score
Preparing for IELTS can feel daunting, but it doesn’t have to be. Learn from experienced tutors who will guide you every step of the way.
-
IELTS preparation online: Take the First Step Towards IELTS Success Today!

Hi I'm Chloe, and I am currently serving as an Product Content Administrator at Prep Education. With over five years of experience in independent online IELTS study and exam preparation, I am confident in my ability to support learners in achieving their highest possible scores.
Comment
Premium content
View all


Personalized roadmap


Most read


UEN: 202227322W
Address: 114 LAVENDER STREET, #11-83 CT HUB 2, SINGAPORE (338729)

