【雅思小作文餅圖全攻略】從基礎到進階,掌握 IELTS Writing Task 1 Pie Chart 核心技巧
如何在 20 分鐘內完成一篇 Band 7+ 的雅思小作文餅圖?許多考生面對雅思小作文 Pie Chart 時常感到困惑:該如何精準解讀百分比數據?怎樣組織文章結構才能突顯關鍵比例關係?使用什麼詞彙能夠準確描述靜態與動態餅圖的變化趨勢?這些問題的答案,將直接決定你的 Task Achievement、Coherence and Cohesion、Lexical Resource 以及 Grammatical Range and Accuracy 四大評分標準的表現。
雅思小作文餅圖本質上是展示「整體與部分關係」的視覺工具,與折線圖的時間趨勢、柱狀圖的數值對比截然不同。你需要在有限時間內完成四個關鍵步驟:精準分析數據找出最大與最小值、改寫題目並撰寫 Overview 總結主要特徵、運用豐富詞彙描述比例關係(account for, constitute, represent)、最後進行有意義的數據比較而非僅列出數字。無論是靜態餅圖的橫向對比,還是動態餅圖結合時間變化的趨勢分析,掌握正確的寫作策略都能讓你從容應對。
本文由 PREPEDU 專業教學團隊整理,提供完整的四段式結構解析、超過 50 個必備高分詞彙與句型、5 種典型題型的完整範文(包含英文原文與繁體中文翻譯)、以及詳細的步驟指導和常見錯誤避坑指南。無論你是初次接觸雅思考試,還是希望突破寫作瓶頸達到 Band 7+,這份全攻略都能幫助你系統提升,在考場上自信發揮。

I. 雅思小作文餅圖(Pie Chart)是什麼?考試格式解析
雅思小作文餅圖本質上是展示「整體中各部分佔比」的視覺工具。與雅思小作文線圖關注時間變化趨勢、柱狀圖突顯數值比較不同,餅圖最擅長展示在特定時間點上,一個整體如何被劃分為不同部分。你需要在 20 分鐘內完成至少 150 字的描述性報告。
餅圖題的兩大類型
1. 靜態餅圖(Static Pie Chart)
靜態餅圖呈現的是某個特定時間點或情況下的數據分布,沒有涉及時間變化。這類圖表通常只有一個餅圖,或者是比較不同地區、不同群體在同一時間點的數據。重點在於「橫向對比」各類別之間的比例關係。
例如:2020年某國家庭支出分配、男性與女性消費模式比較。
2. 動態餅圖(Dynamic Pie Chart)
動態餅圖展示同一主題在不同時間點的變化,通常會有兩個或多個餅圖進行對比。這類題型結合了餅圖的「比例呈現」與折線圖的「趨勢分析」特性,你不僅需要描述各類別的佔比,還要清楚說明這些比例如何隨時間增長、減少或保持穩定。
例如:1990年與2020年全球能源消耗結構比較。

查看更多 IELTS Writing Task 1 的其他題型:
II. 官方評分標準解析:如何拿到雅思小作文餅圖 Band 7+?
理解官方雅思作文評分標準是掌握雅思小作文餅圖寫作的關鍵第一步。IELTS 官方採用四個均等權重的評分標準來評估你的雅思寫作 Task 1 表現,每個標準佔總分的 25%。
|
評分標準 |
佔比 |
評分重點(Band 7+ 要求) |
常見失分原因 |
|
Task Achievement(TA)任務完成度 |
25% |
|
|
|
Coherence and Cohesion(CC)連貫與銜接 |
25% |
|
|
|
Lexical Resource(LR)詞彙多樣性 |
25% |
|
|
|
Grammatical Range and Accuracy(GRA)語法多樣性與準確度 |
25% |
|
|
III. 雅思小作文餅圖靜態題型寫作指南(Static Pie Chart):無時間變化的數據對比
雅思小作文餅圖中的靜態餅圖呈現的是某個特定時間點或情況下的數據分布,重點在於「橫向對比」各類別之間的比例關係。以下是詳細的四步驟寫作流程。
1. 步驟一:分析數據與分類(3-4分鐘)
開始寫作前,你需要花 2-3 分鐘仔細觀察餅圖並識別關鍵特徵。
具體操作方法:
|
標記最大與最小值 |
數據分組 |
計算總和 |
|
|
|
範例分析:
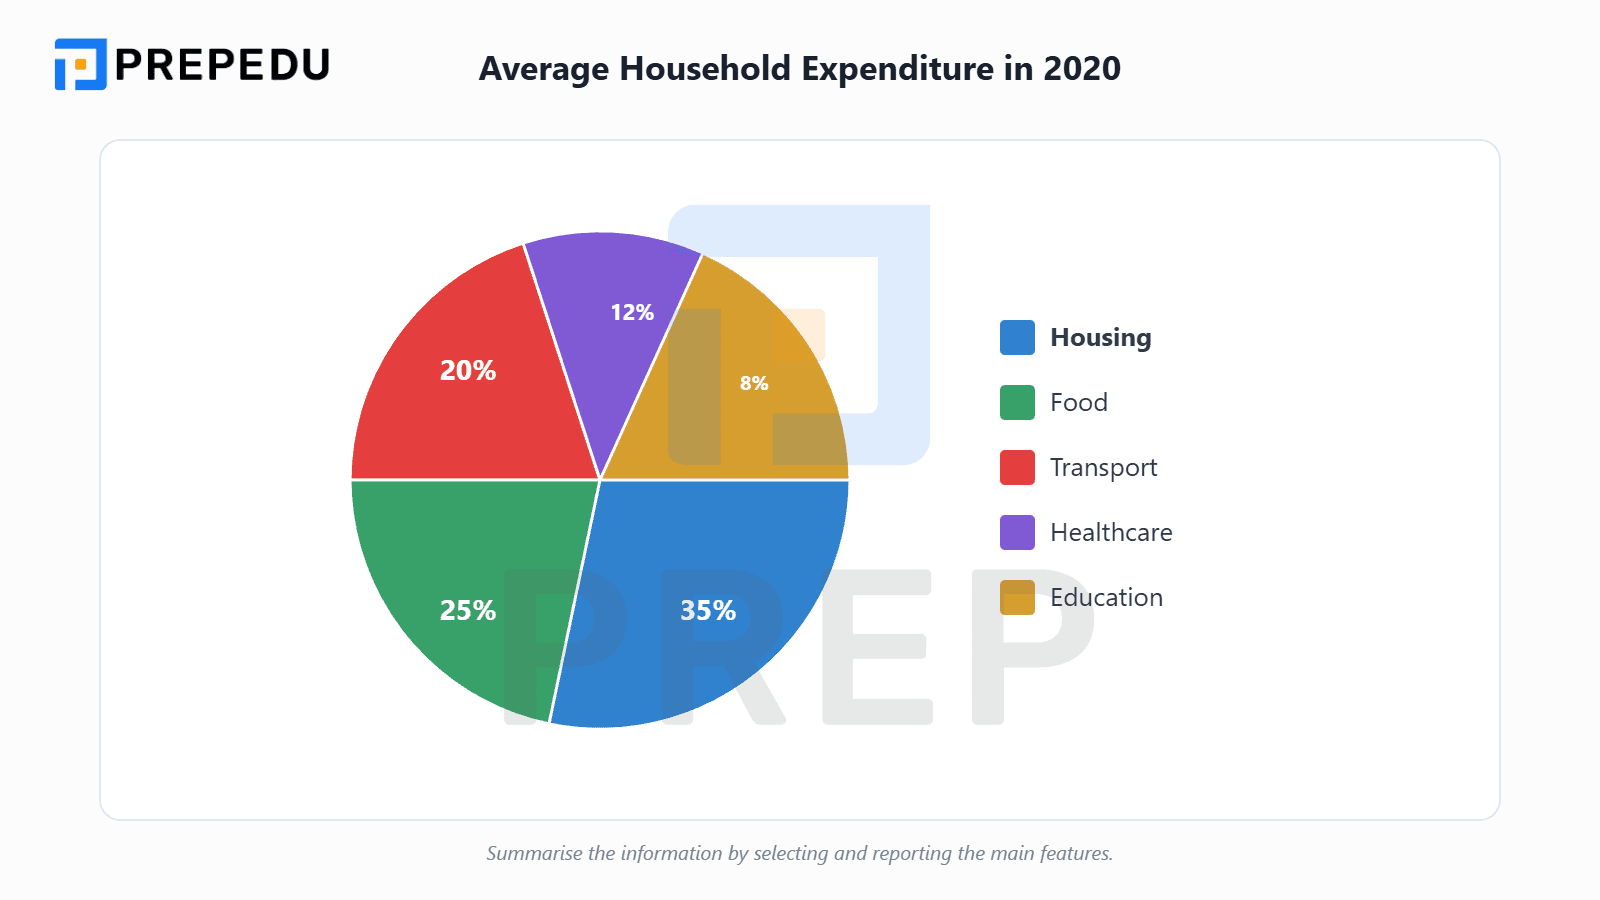
假設餅圖顯示2020年某國家庭支出:
分析筆記:
-
最大:Housing(35%)- 超過三分之一
-
最小:Education(8%)
-
前三大(Housing, Food, Transport)共佔 80%
-
Healthcare 和 Education 合計僅 20%
2. 步驟二:撰寫引言段(Introduction)(2分鐘)
寫作目標:用自己的話改寫題目,說明圖表內容
改寫技巧:
-
替換動詞:show → illustrate / display / present / compare
-
替換名詞:pie chart → circular chart / pie graph
-
替換形容詞:different → various / diverse
-
改變句子結構:主動 ↔ 被動
範例題目:"The pie chart shows the distribution of household expenditure in the UK in 2020."
-
優秀改寫範例 1:"The circular chart illustrates how household spending was allocated across different categories in the United Kingdom during 2020."(圓形圖表說明了 2020 年英國家庭支出如何分配到不同類別。)
-
優秀改寫範例 2:"The pie graph presents information about the breakdown of family expenses in various sectors in the UK for the year 2020."(餅圖呈現了 2020 年英國家庭在各個領域支出的細分資訊。)
-
優秀改寫範例 3:"The diagram displays the proportion of domestic spending distributed among several expenditure categories in Britain in 2020."(該圖表顯示了 2020 年英國國內支出在幾個支出類別中的分配比例。)
注意事項:
-
保持句子簡潔(15-25字)
-
確保改寫後意思準確
-
如果專有名詞難以改寫,可以保留
3. 步驟三:撰寫總結段(Overview)(2-3分鐘)
寫作目標:用 2-3 句話概括圖表的主要特徵,不需要提供具體數值
Overview 是整篇雅思小作文餅圖中最關鍵的段落,它決定了你的 Task Achievement 分數能否達到 IELTS Band 7 以上。
如何提煉關鍵特徵:
|
識別主導類別 |
識別次要類別 |
找出整體模式 |
|
|
|
萬用句型:
|
句型 |
範例 |
|
Overall, it is clear that...(整體而言,很明顯...) |
"Overall, it is clear that housing dominated household expenditure, while education represented the smallest share."(整體而言,很明顯住房支出在家庭開支中佔主導地位,而教育代表最小的份額。) |
|
In general, ...(總的來說...) |
"In general, the three largest categories(housing, food, and transport)accounted for the majority of household spending, while healthcare and education comprised relatively minor proportions."(總的來說,三大類別(住房、食品和交通)佔了家庭支出的大部分,而醫療保健和教育所佔比例相對較小。) |
|
It is noticeable that...(值得注意的是...) |
"It is noticeable that housing expenditure was significantly higher than all other categories, representing more than one-third of total spending."(值得注意的是,住房支出明顯高於所有其他類別,占總支出的三分之一以上。) |
|
完整 Overview 範例:針對上述家庭支出餅圖: "Overall, housing accounted for the largest share of household expenditure, constituting more than one-third of the total budget. In contrast, education represented the smallest proportion at less than one-tenth. Additionally, the three major categories(housing, food, and transport)collectively comprised approximately 80% of all spending." (整體而言,住房佔家庭支出的最大份額,佔總預算的三分之一以上。相比之下,教育所佔比例最小,不到十分之一。此外,三大類別(住房、食品和交通)合計約佔所有支出的 80%。) |
|
4. 步驟四:撰寫細節段落(Body Paragraphs)(8-10分鐘)
在雅思小作文餅圖寫作中,完成 Introduction 和 Overview 後,你需要用兩個細節段落提供具體數據支持。
段落組織策略:
|
策略1:按比例大小分組 |
策略2:按主題相關性分組 |
|
|
詳細寫作範例:
Body Paragraph 1(描述主要類別):
|
"Looking at the major expenditure categories, housing accounted for the largest share at 35%, which was 10 percentage points higher than food spending(25%). Transport represented the third-largest category at 20%, approximately two-thirds of the housing figure. These three categories together comprised 80% of total household expenditure, demonstrating that the majority of family income was allocated to essential living costs." (查看主要支出類別,住房佔最大份額,為 35%,比食品支出(25%)高出 10 個百分點。交通是第三大類別,佔 20%,約為住房數字的三分之二。這三個類別合計佔家庭總支出的 80%,表明大部分家庭收入分配給了基本生活成本。) |
Body Paragraph 2(描述次要類別):
|
"Regarding the remaining categories, healthcare expenditure stood at 12%, while education represented the smallest portion at merely 8%. Despite their relatively modest shares, these two sectors together accounted for one-fifth of the household budget. The significant disparity between the largest category(housing, 35%)and the smallest(education, 8%)highlights the uneven distribution of household spending, with basic necessities dominating the family budget." (關於其餘類別,醫療保健支出為 12%,而教育僅佔 8%,是最小的部分。儘管它們所佔份額相對較小,但這兩個部門合計佔家庭預算的五分之一。最大類別(住房,35%)與最小類別(教育,8%)之間的顯著差距突顯了家庭支出的不均衡分配,基本必需品主導了家庭預算。) |
比較與對比的表達:
|
英文表達 |
中文意思 |
使用情境 |
|
while |
然而 |
對比兩個不同數據 |
|
whereas |
而/然而 |
強調差異 |
|
in contrast |
相比之下 |
顯著對比 |
|
compared with |
與...相比 |
直接比較 |
|
twice as much as |
是...的兩倍 |
倍數關係 |
|
significantly larger/smaller |
顯著更大/更小 |
明顯差異 |
數據描述的變化表達:
同一數據的五種表達方式(以 Housing 35% 為例):
-
"Housing accounted for 35% of total expenditure."(住房佔總支出的 35%。)
-
"Housing expenditure represented more than one-third of the household budget."(住房支出占家庭預算的三分之一以上。)
-
"Spending on housing constituted the largest share at 35%."(住房支出構成最大份額,為 35%。)
-
"The proportion of housing in total spending was 35%."(住房在總支出中的比例為 35%。)
-
"Approximately 35% of household expenditure was allocated to housing."(約 35% 的家庭支出分配給住房。)
IV. 動態餅圖(Dynamic Pie Chart)寫作指南:雅思小作文餅圖的時間趨勢分析
動態餅圖結合了餅圖的「比例呈現」與折線圖的「趨勢分析」特性,展示同一主題在不同時間點的變化。這類雅思小作文餅圖需要你不僅描述各類別的佔比,還要清楚說明這些比例如何隨時間增長、減少或保持穩定。
1. 步驟一:識別趨勢與變化(Trend Identification)(3-4分鐘)
分析動態餅圖的第一步是系統性地標註每個類別的變化方向。
具體分析方法:
-
創建變化追蹤表
|
類別 |
起始年份 |
結束年份 |
變化方向 |
變化幅度 |
|
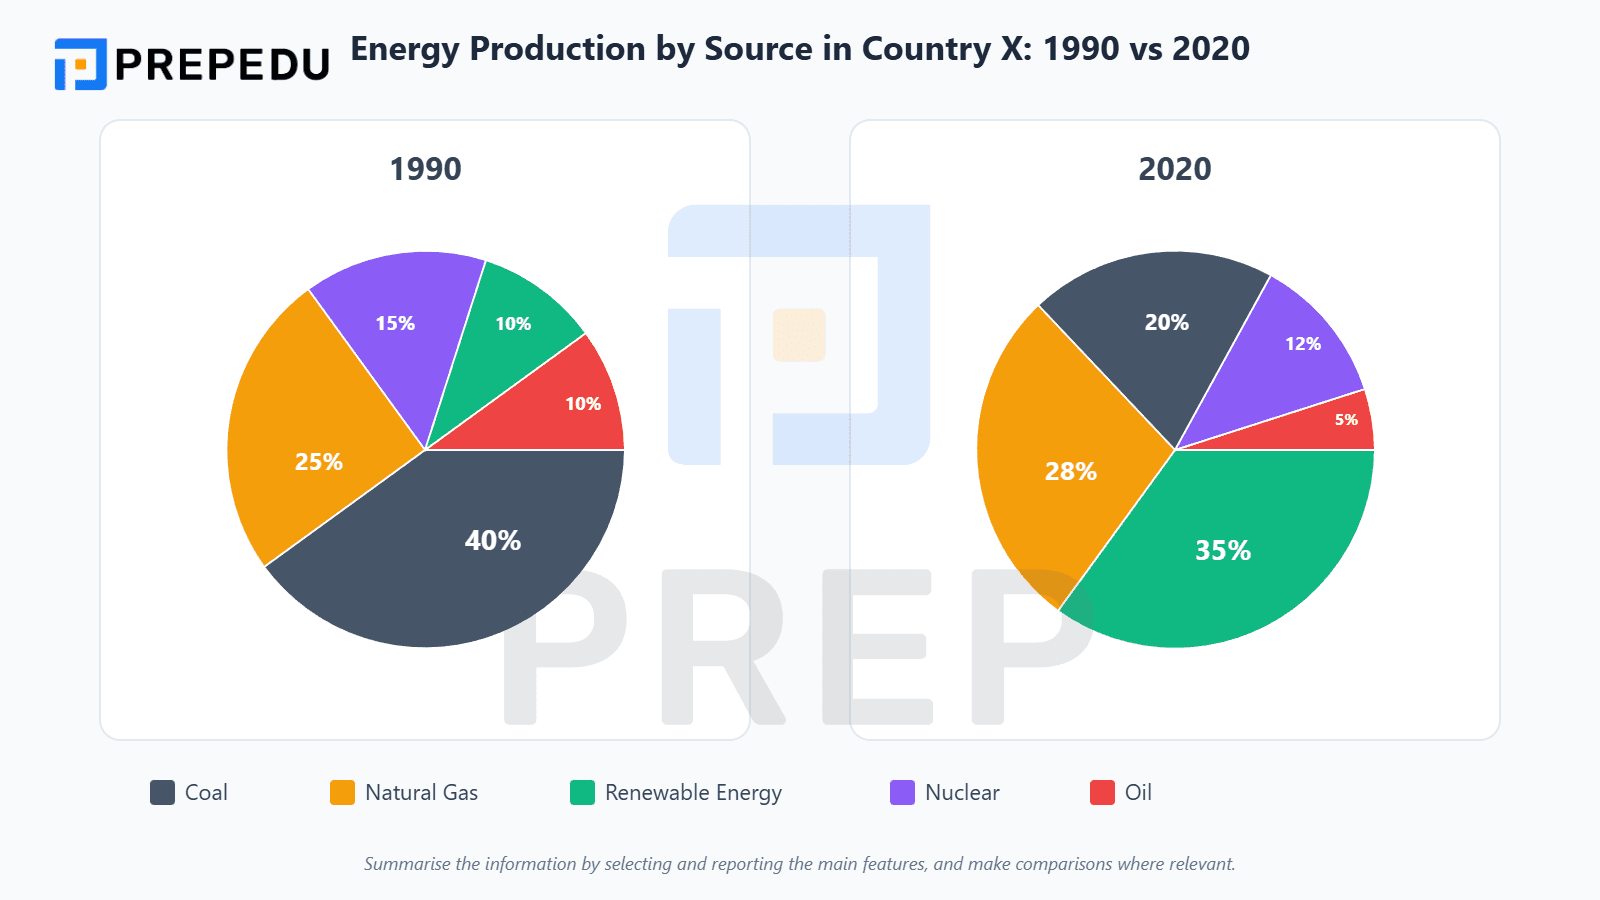
Renewable Energy |
10% |
35% |
↗ 增長 |
+25%(大幅) |
|
Coal |
40% |
20% |
↘ 下降 |
-20%(顯著) |
|
Natural Gas |
25% |
28% |
↗ 增長 |
+3%(輕微) |
|
Nuclear |
15% |
12% |
↘ 下降 |
-3%(輕微) |
|
Oil |
10% |
5% |
↘ 下降 |
-5%(中等) |
-
將變化按照方向分組
|
增長組 |
下降組 |
|
|
-
識別關鍵特徵
-
主導地位轉變:從 Coal(40%)轉為 Renewable Energy(35%)
-
最劇烈變化:Renewable Energy 增長最多
-
穩定項目:Natural Gas 相對穩定
範例題目:"The pie charts below show energy production by source in Country X in 1990 and 2020."
2. 步驟二:撰寫引言與確定時態(2-3分鐘)
在雅思小作文餅圖中,動態圖表的引言需要明確包含時間跨度,這是與靜態圖表的重要區別。
時態選擇規則:
-
數據在過去 → 使用過去式
-
包含現在或未來 → 使用對應時態
-
整篇文章保持時態一致
引言改寫範例:
原題目:"The pie charts below show energy production by source in Country X in 1990 and 2020."
-
改寫 1:"The two circular charts compare the distribution of energy generation across different sources in Country X over a 30-year period from 1990 to 2020."(兩個圓形圖比較了 X 國從 1990 年到 2020 年 30 年間不同來源的能源產生分布。)
-
改寫 2:"The pie graphs illustrate changes in the composition of energy production by various sources in Country X between 1990 and 2020."(餅圖說明了 1990 年至 2020 年間 X 國各種能源生產構成的變化。)
-
改寫 3:"The diagrams present information about how energy sources contributed to total production in Country X at two different time points:1990 and 2020."(圖表呈現了能源來源如何在兩個不同時間點(1990 年和 2020 年)為 X 國的總生產做出貢獻的資訊。)
時間跨度的多種表達:
-
over a 30-year period(在 30 年期間)
-
from 1990 to 2020(從 1990 年到 2020 年)
-
between 1990 and 2020(在 1990 年和 2020 年之間)
-
during the three-decade span(在三十年的時間跨度內)
3. 步驟三:撰寫動態總結(Dynamic Overview)(2-3分鐘)
動態雅思小作文餅圖的 Overview 需要突出顯著的變化趨勢而非僅僅描述靜態比例。
如何撰寫動態 Overview:
|
指出最劇烈的變化 |
描述主導地位的轉變 |
說明整體結構變化 |
|
|
|
Overview 萬用句型:
|
句型 |
範例 |
|
突出最大變化:"Overall, [category] experienced the most substantial growth, while [category] saw the most significant decline." |
"Overall, renewable energy experienced the most substantial growth over the period, while coal saw the most significant decline in its share of energy production."(整體而言,可再生能源在此期間經歷了最大幅度的增長,而煤炭在能源生產中的份額則出現了最顯著的下降。) |
|
描述主導地位轉變:"Notably, [category] overtook [category] to become the dominant/leading source by [year]." |
"Notably, renewable energy overtook coal to become the dominant energy source by 2020, representing a complete reversal of the situation in 1990."(值得注意的是,到 2020 年,可再生能源超越煤炭成為主要能源來源,這與 1990 年的情況完全相反。) |
|
對比增減趨勢:"While [category] and [category] showed upward trends, [category] and [category] experienced corresponding declines." |
"While renewable energy and natural gas showed upward trends, coal and oil experienced corresponding declines, indicating a shift towards cleaner energy sources."(雖然可再生能源和天然氣呈上升趨勢,但煤炭和石油則出現相應下降,顯示向更清潔能源來源的轉變。) |
|
完整動態 Overview 範例: "Overall, the energy production landscape in Country X underwent significant transformation between 1990 and 2020. Renewable energy experienced the most dramatic growth, rising from 10% to 35% and overtaking coal as the primary energy source. Conversely, coal saw the steepest decline, falling from 40% to 20%. Natural gas remained relatively stable with only a slight increase, while both nuclear and oil power decreased moderately during this period." (整體而言,X 國的能源生產格局在 1990 年至 2020 年間經歷了重大轉變。可再生能源經歷了最顯著的增長,從 10% 上升至 35%,超越煤炭成為主要能源來源。相反,煤炭則出現了最急劇的下降,從 40% 降至 20%。天然氣僅略有增長,保持相對穩定,而核能和石油在此期間均出現中度下降。) |
|
4. 步驟四:撰寫細節描述段(Body Paragraphs)(8-10分鐘)
在雅思小作文餅圖寫作中,動態圖表的細節段落需要同時處理「比例」和「變化」兩個維度。
段落組織策略:
|
策略1:按變化方向分組 |
策略2:按時間點分組 |
|
|
推薦策略:按變化方向分組,更能突出趨勢對比
Body Paragraph 1 寫作範例(增長類別):
|
"Examining the categories that experienced growth, renewable energy demonstrated the most remarkable expansion. In 1990, it accounted for merely 10% of total energy production, but this figure more than tripled to reach 35% by 2020, making it the largest single source. This substantial increase of 25 percentage points represented a fundamental shift in the country's energy strategy. Natural gas also showed positive growth, albeit more modest, rising from 25% to 28% over the same period. The combined contribution of these two cleaner energy sources increased from 35% to 63%, indicating a clear move towards more sustainable energy production." (檢視經歷增長的類別,可再生能源展現了最顯著的擴張。1990 年,它僅佔總能源生產的 10%,但到 2020 年,這一數字增加了三倍多,達到 35%,使其成為最大的單一來源。25 個百分點的大幅增長代表了該國能源戰略的根本轉變。天然氣也顯示出正增長,儘管較為溫和,在同一時期從 25% 上升至 28%。這兩種較清潔能源來源的合計貢獻從 35% 增加到 63%,顯示出向更可持續能源生產的明確轉變。) |
Body Paragraph 2 寫作範例(下降類別):
|
"In contrast, traditional fossil fuel sources experienced notable declines during this period. Coal, which had been the dominant energy source in 1990 at 40%, fell sharply to 20% by 2020, losing its leading position to renewable energy. This represented a 50% reduction in its share of total energy production. Oil showed a similar downward trend, halving from 10% to 5% over the three decades. Nuclear energy also decreased slightly from 15% to 12%, though less dramatically than the fossil fuel categories. The collective share of these three traditional sources declined from 65% to 37%, clearly reflecting the gradual phasing out of conventional energy production methods." (相比之下,傳統化石燃料來源在此期間經歷了顯著下降。煤炭曾是 1990 年的主要能源來源,佔 40%,但到 2020 年急劇下降至 20%,將其領先地位讓給了可再生能源。這代表其在總能源生產中的份額減少了 50%。石油顯示出類似的下降趨勢,在三十年間從 10% 減半至 5%。核能也從 15% 輕微下降至 12%,儘管不如化石燃料類別那麼劇烈。這三種傳統能源的總份額從 65% 下降至 37%,清楚地反映了傳統能源生產方式的逐步淘汰。) |
描述變化的必備詞彙:
|
變化類型 |
動詞 |
副詞 |
例句 |
|
大幅上升 |
surge, soar, rocket |
dramatically, substantially, significantly |
Renewable energy surged dramatically from 10% to 35%.(再生能源從 10% 大幅飆升至 35%。) |
|
中等上升 |
increase, rise, grow |
moderately, considerably |
Natural gas increased moderately from 25% to 28%.(天然氣從 25% 適度上升至 28%。) |
|
輕微上升 |
edge up, climb slightly |
slightly, marginally |
Nuclear power edged up slightly from 15% to 17%.(核能從 15% 小幅上升至 17%。) |
|
大幅下降 |
plunge, plummet, collapse |
sharply, steeply, drastically |
Coal production plummeted sharply from 40% to 20%.(煤炭產量從 40% 急劇下滑至 20%。) |
|
中等下降 |
decrease, decline, fall |
moderately, noticeably |
Oil decreased moderately from 10% to 5%.(石油從 10% 中度下降至 5%。) |
|
輕微下降 |
dip slightly, fall marginally |
slightly, marginally |
Nuclear dipped slightly from 15% to 12%.(核能從 15% 略微下降至 12%。) |
|
保持穩定 |
remain stable, stay constant |
relatively, largely |
Natural gas remained relatively stable throughout the period.(在整個期間內,天然氣的比例相對保持穩定。) |
V. 雅思小作文餅圖必備高分詞彙與萬用句型
掌握豐富且準確的詞彙表達是提升雅思小作文餅圖寫作水平的關鍵要素。以下整理的詞彙和句型涵蓋了描述比例、進行比較、說明變化等核心需求。
1. 描述比例與組成的動詞
|
英文詞彙 |
中文意思 |
例句 |
|
account for /əˈkaʊnt fɔːr/ |
佔據、構成 |
Housing accounted for 35% of total expenditure.(住房佔總支出的 35%。) |
|
constitute /ˈkɒnstɪtjuːt/ |
構成、組成 |
Food and transport constituted half of the household budget.(食品和交通構成了家庭預算的一半。) |
|
make up /meɪk ʌp/ |
組成、構成 |
Healthcare and education made up 20% of spending.(醫療保健和教育佔支出的 20%。) |
|
represent /ˌreprɪˈzent/ |
代表、佔比 |
Entertainment represented the smallest segment at 5%.(娛樂是最小的部分,佔 5%。) |
|
comprise /kəmˈpraɪz/ |
包含、由...組成 |
The service sector comprised 40% of the economy.(服務業佔經濟的 40%。) |
|
take up /teɪk ʌp/ |
佔據 |
Transport took up one-fifth of the monthly income.(交通佔據了月收入的五分之一。) |
2. 分數與百分比的替換表達
|
百分比 |
分數表達 |
描述性表達 |
|
75% |
three-quarters |
a very large majority |
|
66% |
two-thirds |
a significant proportion |
|
50% |
half / one-half |
approximately half |
|
33% |
one-third / a third |
roughly a third |
|
25% |
one-quarter / a quarter |
about a quarter |
|
20% |
one-fifth / a fifth |
around a fifth |
|
10% |
one-tenth |
a small proportion |
|
5% |
one-twentieth |
a very small percentage |
使用範例:
-
77% → "just over three-quarters"(略超過四分之三)
-
52% → "approximately half"(約一半)
-
49% → "just under half"(略低於一半)
-
32% → "almost a third"(接近三分之一)
3. 描述程度的副詞
|
程度 |
副詞 |
中文意思 |
|
大幅度 |
dramatically, substantially, significantly, considerably |
顯著地、大幅度地 |
|
中等 |
moderately, noticeably |
適度地、明顯地 |
|
輕微 |
slightly, marginally, fractionally |
輕微地、略微地 |
|
準確 |
exactly, precisely |
正好、精確地 |
|
約略 |
approximately, roughly, about, around |
大約、大概 |
|
接近 |
nearly, almost, just under |
幾乎、接近 |
|
略超過 |
just over, slightly more than |
略微超過 |
4. 比較與對比的句型結構
|
英文句型結構 |
例句 |
|
A + be + 比較級 + than + B |
Housing expenditure was significantly larger than education spending.(住房支出明顯大於教育支出。) |
|
A + account for + X%, which + be + 比較級 + than + B |
Transport accounted for 20%, which was twice as high as education at 10%.(交通佔 20%,是教育(10%)的兩倍。) |
|
While A + verb, B + verb |
While renewable energy grew substantially, coal declined sharply over the period.(雖然可再生能源大幅增長,但煤炭在此期間急劇下降。) |
|
In comparison to A, B + verb |
In comparison to 1990, when coal dominated at 40%, renewable energy had become the primary source by 2020.(與 1990 年煤炭佔主導地位(40%)相比,到 2020 年可再生能源已成為主要來源。) |
|
The proportion of A..., followed by B... |
The proportion of spending on housing was highest at 35%, followed by food at 25% and transport at 20%.(住房支出比例最高,為 35%,其次是食品(25%)和交通(20%)。) |
5. 引言與總結的萬用句型
Introduction 常用句型:
|
句型 |
例句 |
|
The pie chart illustrates / displays / compares... |
The pie chart illustrates the distribution of household expenditure in 2020.(餅圖說明了 2020 年家庭支出的分布。) |
|
The circular chart shows / presents... |
The circular chart shows the breakdown of energy consumption by source.(圓形圖顯示了按來源劃分的能源消耗細分。) |
|
The graphs compare... |
The graphs compare spending patterns in two different countries.(圖表比較了兩個不同國家的支出模式。) |
|
The diagrams provide information about... |
The diagrams provide information about changes in transportation methods.(圖表提供了交通方式變化的資訊。) |
Overview 常用開頭:
|
開頭語 |
例句 |
|
Overall, it is clear that... |
Overall, it is clear that housing dominated household expenditure.(整體而言,很明顯住房在家庭支出中佔主導地位。) |
|
In general,... |
In general, the three largest categories accounted for the majority of spending.(總的來說,三大類別佔了大部分支出。) |
|
It is noticeable that... |
It is noticeable that renewable energy increased significantly over the period.(值得注意的是,可再生能源在此期間大幅增加。) |
|
The most striking feature is that... |
The most striking feature is that education represented the smallest share.(最顯著的特徵是教育所佔份額最小。) |
6. 描述主導地位的表達
|
英文表達 |
中文意思 |
例句 |
|
dominate / dominated |
主導、佔主導地位 |
Housing dominated the household budget.(住房主導了家庭預算。) |
|
account for the largest share |
佔最大份額 |
Food accounted for the largest share of expenditure.(食品佔支出的最大份額。) |
|
represent the biggest proportion |
代表最大比例 |
Transport represented the biggest proportion at 30%.(交通佔最大比例,為 30%。) |
|
constitute the majority |
構成大多數 |
These three categories constituted the majority of spending.(這三個類別構成了大部分支出。) |
|
take the lead |
處於領先地位 |
Renewable energy took the lead in 2020.(可再生能源在 2020 年處於領先地位。) |
|
overtake... to become |
超越...成為 |
Solar power overtook coal to become the dominant source.(太陽能超越煤炭成為主要來源。) |
7. 描述最小比例的表達
|
英文表達 |
中文意思 |
例句 |
|
represent the smallest segment |
代表最小部分 |
Education represented the smallest segment at 8%.(教育是最小的部分,佔 8%。) |
|
account for the least proportion |
佔最少比例 |
Healthcare accounted for the least proportion of spending.(醫療保健佔支出的最少比例。) |
|
comprise the minimum share |
構成最小份額 |
Entertainment comprised the minimum share at 5%.(娛樂構成最小份額,為 5%。) |
|
represent merely / only |
僅僅代表 |
Savings represented merely 3% of the budget.(儲蓄僅佔預算的 3%。) |
VI. 雅思小作文餅圖範文解析:5 類典型題型
通過分析不同類型的雅思小作文餅圖範文與雅思寫作模板,你能夠更深入理解如何將理論知識有效應用於實際寫作中。以下五個典型題型結合實用的雅思寫作模板,涵蓋了從基礎到進階的各種情境,每個範文都附有完整的英文版本和繁體中文翻譯,協助考生快速掌握高分寫作結構。
1. 類型一:單一靜態雅思小作文餅圖(基礎比例描述)
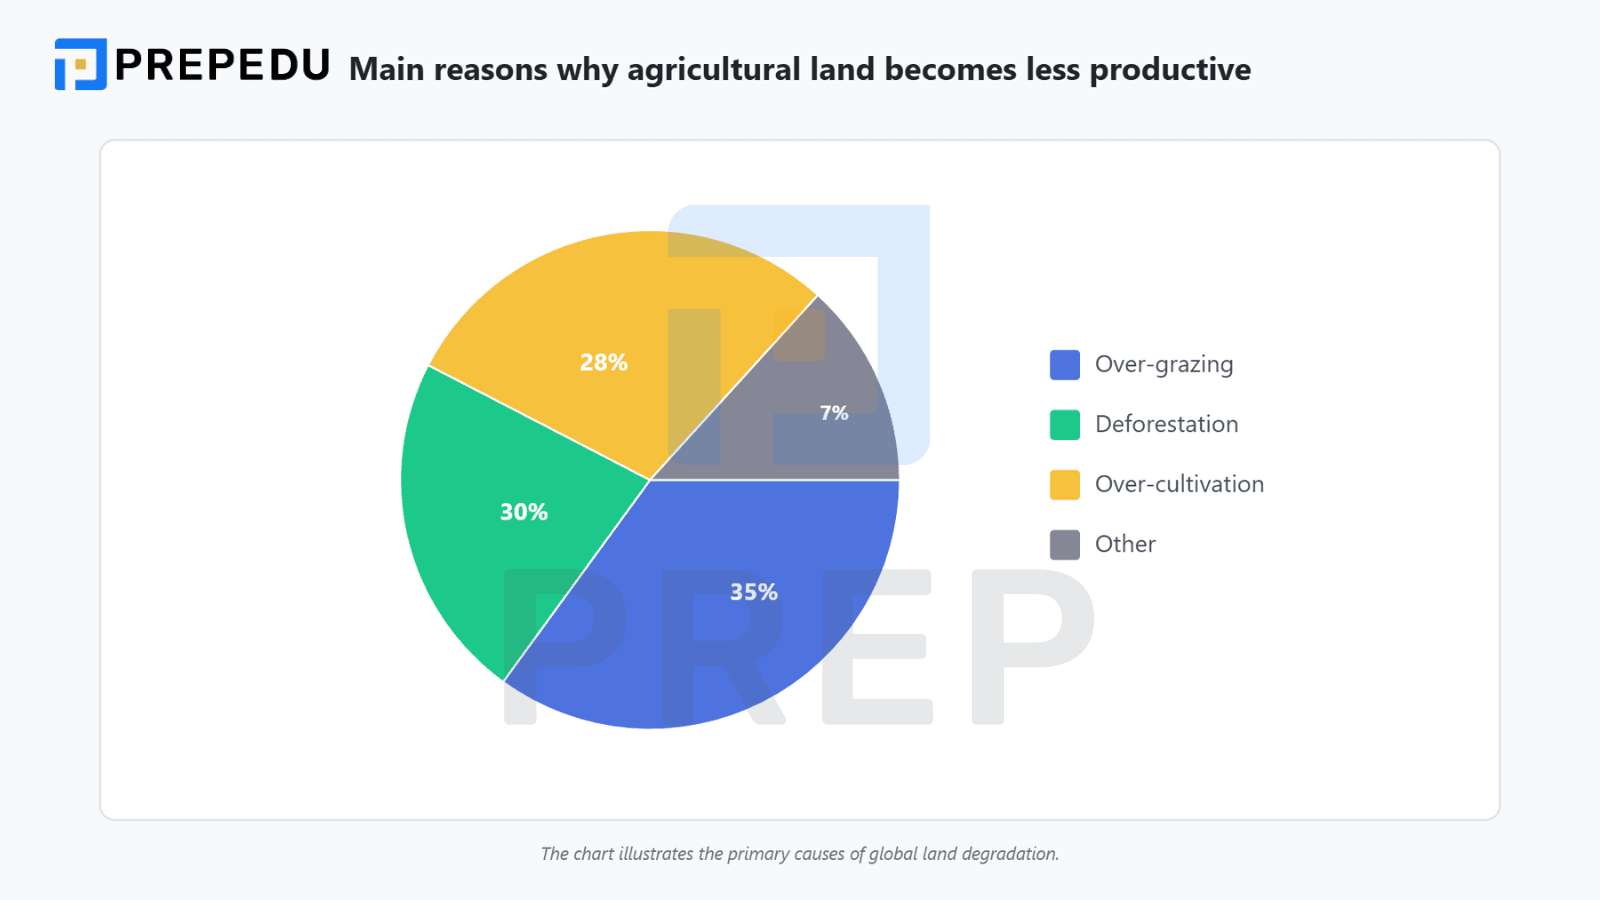
題目(Question):The pie chart below shows the main reasons why agricultural land becomes less productive. Summarise the information by selecting and reporting the main features.
完整範文:
|
The circular chart illustrates the primary factors contributing to land degradation worldwide. Overall, over-grazing emerges as the dominant cause of reduced agricultural productivity, while other miscellaneous factors represent the smallest proportion. Additionally, the three major causes(over-grazing, deforestation, and over-cultivation)collectively account for approximately 93% of all land degradation. Over-grazing accounts for the largest proportion of land degradation at 35%, making it the most critical factor affecting agricultural productivity. This is followed closely by deforestation, which constitutes 30% of the problem, representing nearly one-third of all causes. These two factors alone are responsible for almost two-thirds of land productivity decline. The remaining factors show smaller but notable contributions. Over-cultivation makes up 28% of land degradation, slightly less than deforestation but still representing more than a quarter of the total. In contrast, other miscellaneous causes account for merely 7%, the smallest segment in the chart, suggesting these factors have minimal impact compared to the three major contributors. |
|
繁體中文翻譯: 圓形圖表說明了導致全球土地退化的主要因素。 整體而言,過度放牧是導致農業生產力下降的主要原因,而其他雜項因素所佔比例最小。此外,三個主要原因(過度放牧、森林砍伐和過度耕作)合計約佔所有土地退化的 93%。 過度放牧佔土地退化的最大比例,為 35%,使其成為影響農業生產力最關鍵的因素。緊隨其後的是森林砍伐,佔問題的 30%,幾乎佔所有原因的三分之一。僅這兩個因素就造成了近三分之二的土地生產力下降。 其餘因素顯示出較小但值得注意的貢獻。過度耕作佔土地退化的 28%,略低於森林砍伐,但仍佔總數的四分之一以上。相比之下,其他雜項原因僅佔 7%,是圖表中最小的部分,顯示與三個主要貢獻者相比,這些因素的影響微乎其微。 |
2. 類型二:雙雅思小作文餅圖對比(不同國家/地區比較)
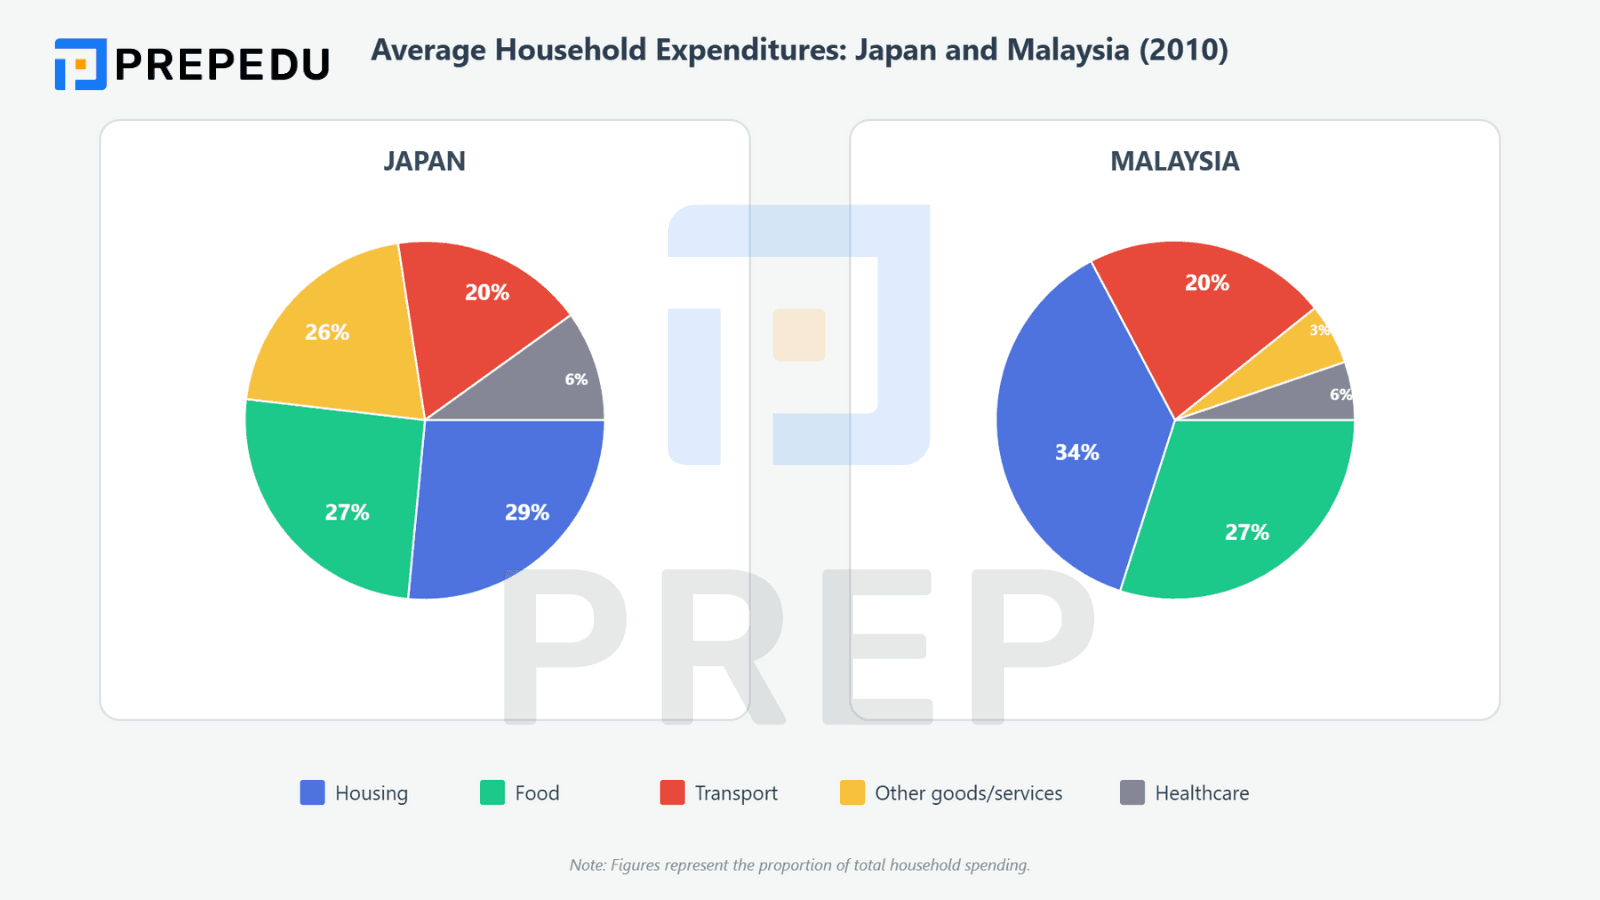
題目(Question):The pie charts below show the average household expenditures in Japan and Malaysia in 2010. Summarise the information by selecting and reporting the main features, and make comparisons where relevant.
完整範文:
|
The circular charts compare the distribution of household spending across different categories in Japan and Malaysia during 2010. Overall, while housing dominated expenditure in both countries, the spending patterns showed marked differences in several categories. Food represented an equal proportion in both nations, whereas the allocation for other goods and services varied significantly. Additionally, transport and healthcare expenditures remained relatively similar across both countries. In Japan, housing accounted for the largest share at 29%, followed by food and other goods and services, which comprised 27% and 26% respectively. These three categories together represented over 80% of total household expenditure, indicating a concentration in these essential areas. Transport spending stood at 20%, while healthcare occupied the smallest portion at merely 6%. Malaysian household spending presented a different pattern. Food dominated the budget at 27%, matching Japan's proportion, but housing represented a significantly larger share of 34% compared to Japan's 29%. Transport expenditure was identical in both countries at 20%, while healthcare also remained the same at 6%. However, a striking difference emerged in the category of other goods and services, which accounted for only 3% in Malaysia compared to Japan's 26%, suggesting distinct spending priorities between the two nations. |
|
繁體中文翻譯: 圓形圖比較了 2010 年日本和馬來西亞家庭支出在不同類別中的分布。 整體而言,雖然住房在兩國的支出中都佔主導地位,但支出模式在幾個類別中顯示出明顯差異。食品在兩國所佔比例相同,而其他商品和服務的分配則有顯著差異。此外,交通和醫療保健支出在兩國保持相對相似。 在日本,住房佔最大份額,為 29%,其次是食品和其他商品和服務,分別佔 27% 和 26%。這三個類別合計占家庭總支出的 80% 以上,表明在這些基本領域的集中。交通支出為 20%,而醫療保健僅佔最小部分,為 6%。 馬來西亞的家庭支出呈現出不同的模式。食品以 27% 主導預算,與日本的比例相同,但住房所佔份額明顯更大,為 34%,而日本為 29%。兩國的交通支出相同,均為 20%,醫療保健也保持相同,為 6%。然而,在其他商品和服務類別中出現了顯著差異,馬來西亞僅佔 3%,而日本為 26%,顯示兩國之間有不同的支出優先事項。 |
3. 類型三:動態雅思小作文餅圖(隨時間變化)
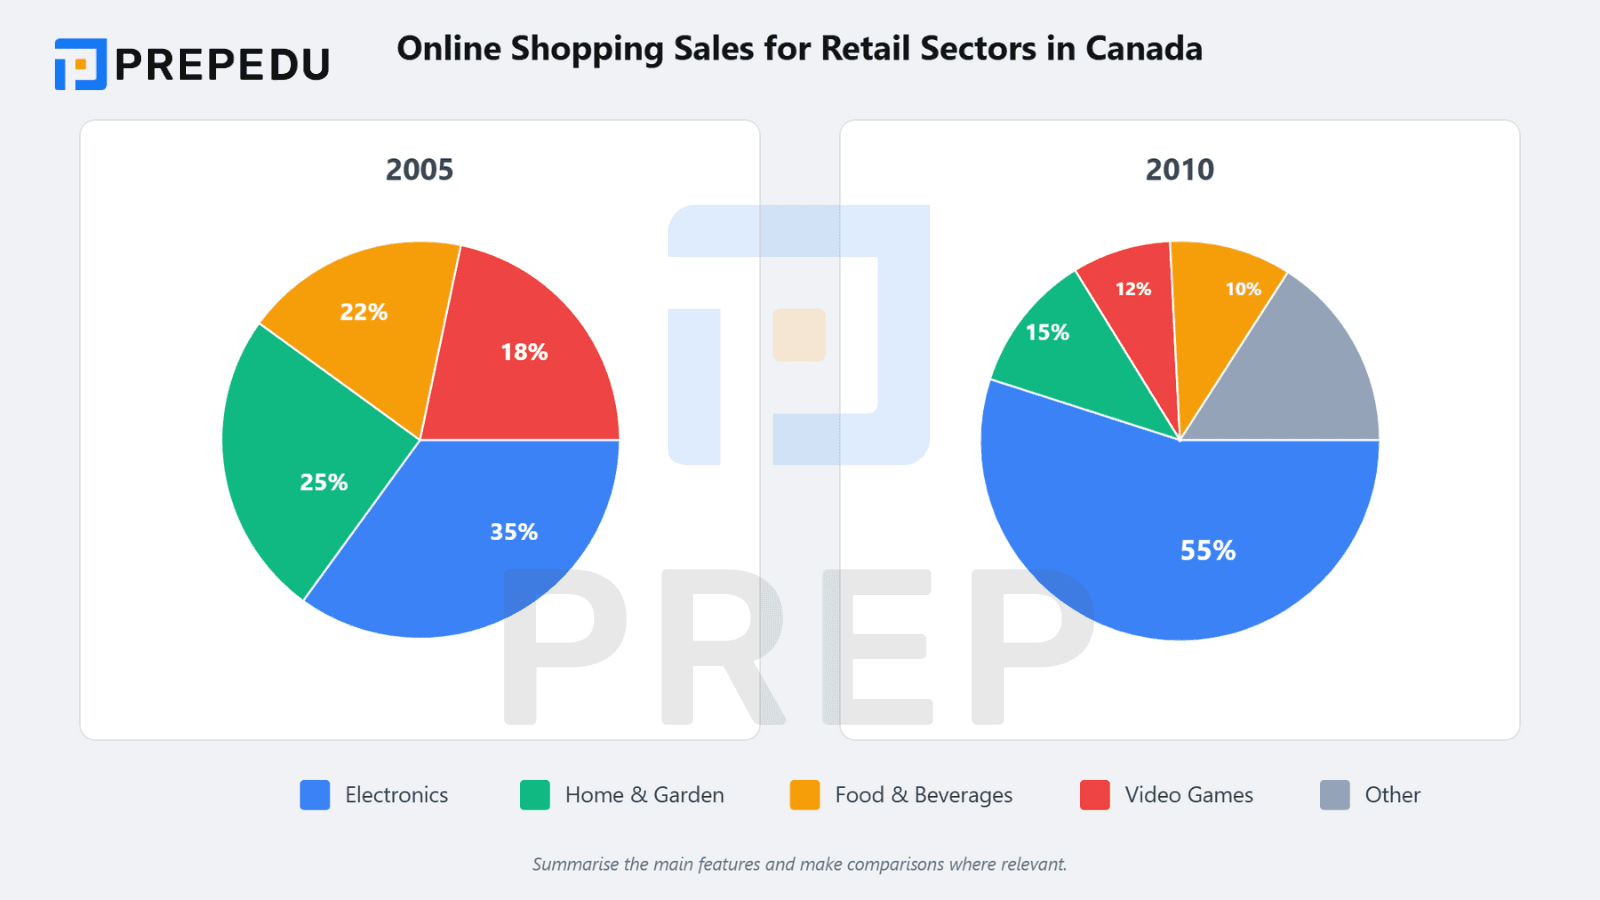
題目(Question):The pie charts below show the online shopping sales for retail sectors in Canada in 2005 and 2010. Summarise the information by selecting and reporting the main features, and make comparisons where relevant.
完整範文:
|
The circular charts illustrate changes in the distribution of online retail sales across four sectors in Canada over a five-year period from 2005 to 2010. Overall, electronics emerged as the dominant sector by 2010, experiencing substantial growth, while food and beverages demonstrated the most dramatic decline in market share. Additionally, all sectors except electronics saw reductions in their proportions, indicating a consolidation of the online retail market around electronic products. In 2005, the online retail market showed relatively balanced distribution, with electronics accounting for 35%, home and garden 25%, food and beverages 22%, and video games 18%. However, by 2010, this pattern had shifted considerably. Electronics expanded its dominance substantially, rising to 55% of total sales, which represented an increase of 20 percentage points and made it the clear market leader. This growth meant that electronics alone constituted more than half of all online retail sales. Conversely, the other three sectors witnessed contractions in their market shares. Food and beverages experienced the sharpest decline, plummeting from 22% to merely 10%, losing more than half of its previous market share. Home and garden also fell significantly, from 25% to 15%, representing a 10 percentage point decrease. Video games declined more moderately from 18% to 12%, showing a 6 percentage point reduction. These decreases directly corresponded to electronics' expansion, clearly demonstrating a shift in consumer preferences towards electronic products in online shopping environments. |
|
繁體中文翻譯: 圓形圖說明了 2005 年至 2010 年五年期間加拿大四個零售部門線上銷售分布的變化。 整體而言,電子產品到 2010 年成為主導部門,經歷了大幅增長,而食品和飲料則顯示出市場份額最顯著的下降。此外,除電子產品外,所有部門的比例都出現了下降,顯示線上零售市場圍繞電子產品進行整合。 2005 年,線上零售市場顯示出相對平衡的分布,電子產品佔 35%,家居和園藝佔 25%,食品和飲料佔 22%,電子遊戲佔 18%。然而,到 2010 年,這種模式發生了相當大的變化。電子產品大幅擴展其主導地位,上升至總銷售額的 55%,增加了 20 個百分點,使其成為明顯的市場領導者。這一增長意味著僅電子產品就占所有線上零售銷售額的一半以上。 相反,其他三個部門的市場份額出現了收縮。食品和飲料經歷了最急劇的下降,從 22% 暴跌至僅 10%,損失了其先前市場份額的一半以上。家居和園藝也大幅下降,從 25% 降至 15%,減少了 10 個百分點。電子遊戲從 18% 降至 12%,下降幅度較為溫和,顯示出 6 個百分點的減少。這些下降直接對應於電子產品的擴張,清楚地展示了消費者偏好在線上購物環境中向電子產品轉移。 |
4. 類型四:雅思小作文餅圖 + 柱狀圖組合(多維度比較)
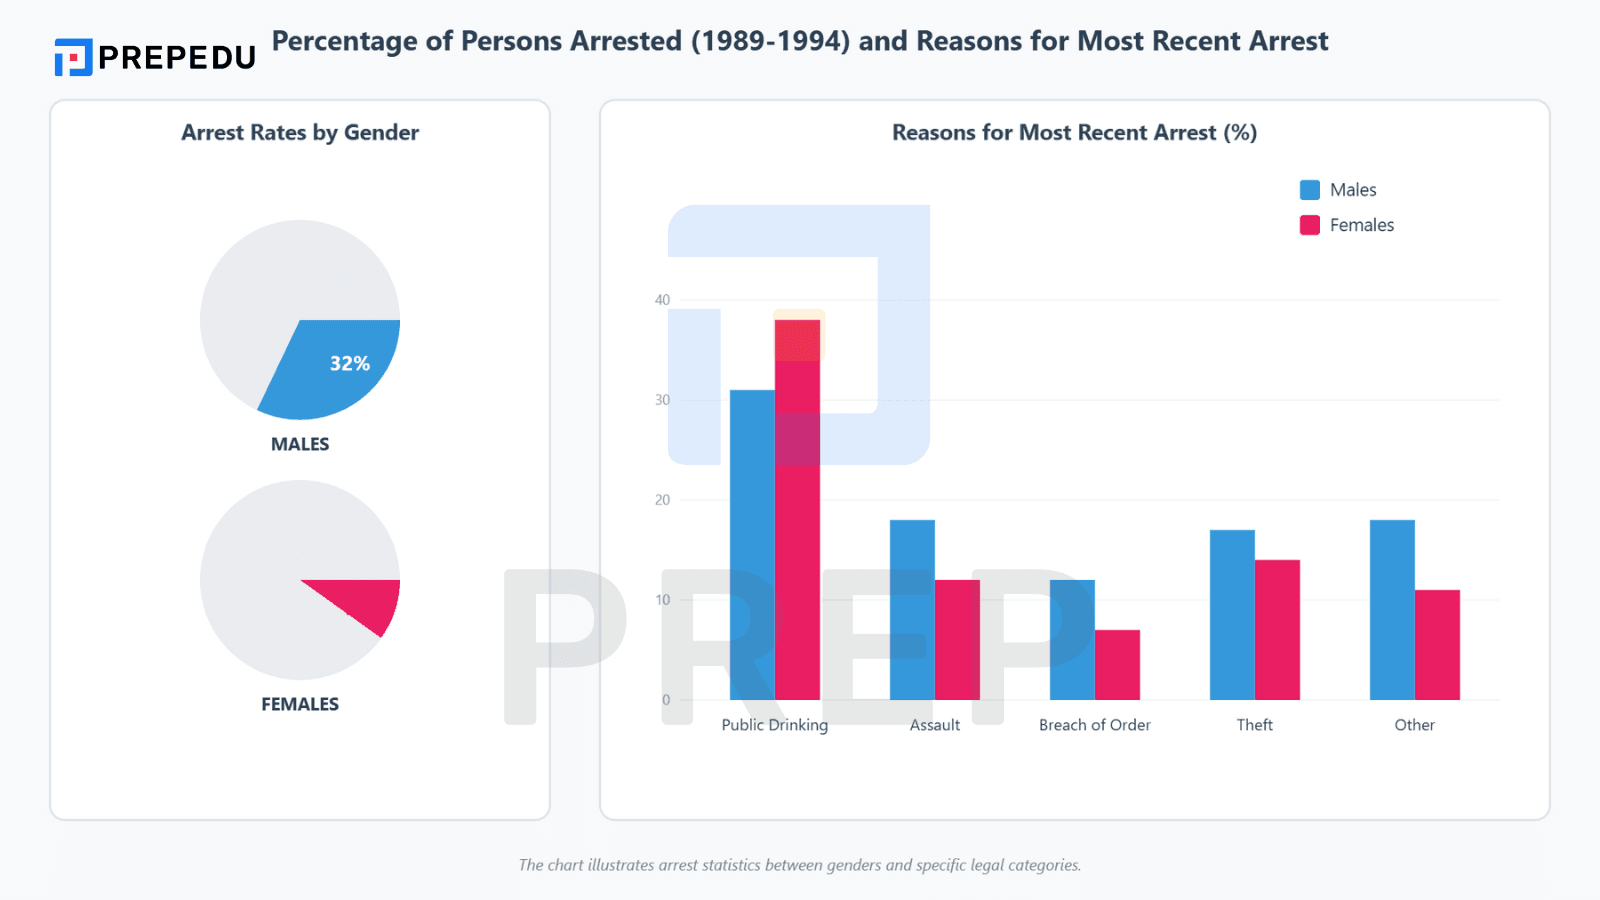
題目(Question):The pie chart shows the percentage of persons arrested in the five years ending 1994 and the bar chart shows the most recent reasons for arrest. Summarise the information by selecting and reporting the main features.
完整範文:
|
The two charts provide information about arrests during a five-year period ending in 1994, with the pie chart illustrating gender distribution and the bar chart detailing reasons for arrest by gender. Overall, males constituted the vast majority of arrests, and public drinking emerged as the most common cause for both genders, though with notable gender differences in arrest reasons. Additionally, males showed higher arrest rates across most categories, with the exception of public drinking where females had a marginally higher percentage. According to the pie chart, males accounted for 32% of all arrests during this period, which was more than three times higher than females at merely 9%. This substantial gender disparity indicates that arrest rates were significantly higher among men than women, reflecting broader patterns in criminal justice data. The bar chart reveals that public drinking was the predominant arrest reason, with 31% of males and 38% of females arrested for this cause, making it the only category where female arrest rates exceeded those of males. Assault represented the second-highest reason for male arrests at 18%, compared to 12% for females. Both genders showed relatively similar rates for theft, with 17% of males and 14% of females arrested for this offence. Other offences accounted for 18% of male arrests compared to 11% for females, while breach of order showed 12% for males and 7% for females, maintaining the pattern of higher male involvement in most arrest categories. |
|
繁體中文翻譯: 兩個圖表提供了截至 1994 年五年期間逮捕情況的資訊,餅圖說明了性別分布,柱狀圖詳細說明了按性別劃分的逮捕原因。 整體而言,男性構成了絕大多數逮捕案件,公共飲酒成為兩性最常見的原因,儘管在逮捕原因方面存在顯著的性別差異。此外,男性在大多數類別中顯示出更高的逮捕率,但公共飲酒除外,女性的百分比略高。 根據餅圖,男性在此期間佔所有逮捕案件的 32%,是女性(僅 9%)的三倍多。這種顯著的性別差異表明,男性的逮捕率明顯高於女性,反映了刑事司法數據中更廣泛的模式。 柱狀圖顯示,公共飲酒是主要的逮捕原因,31% 的男性和 38% 的女性因此被捕,使其成為唯一女性逮捕率超過男性的類別。襲擊是男性逮捕的第二大原因,佔 18%,而女性為 12%。兩性在盜竊方面顯示出相對相似的比率,17% 的男性和 14% 的女性因此罪行被捕。其他罪行佔男性逮捕的 18%,而女性為 11%,而違反秩序顯示男性為 12%,女性為 7%,保持了大多數逮捕類別中男性參與率較高的模式。 |
5. 類型五:雅思小作文餅圖 + 表格組合(Simon 經典題型)
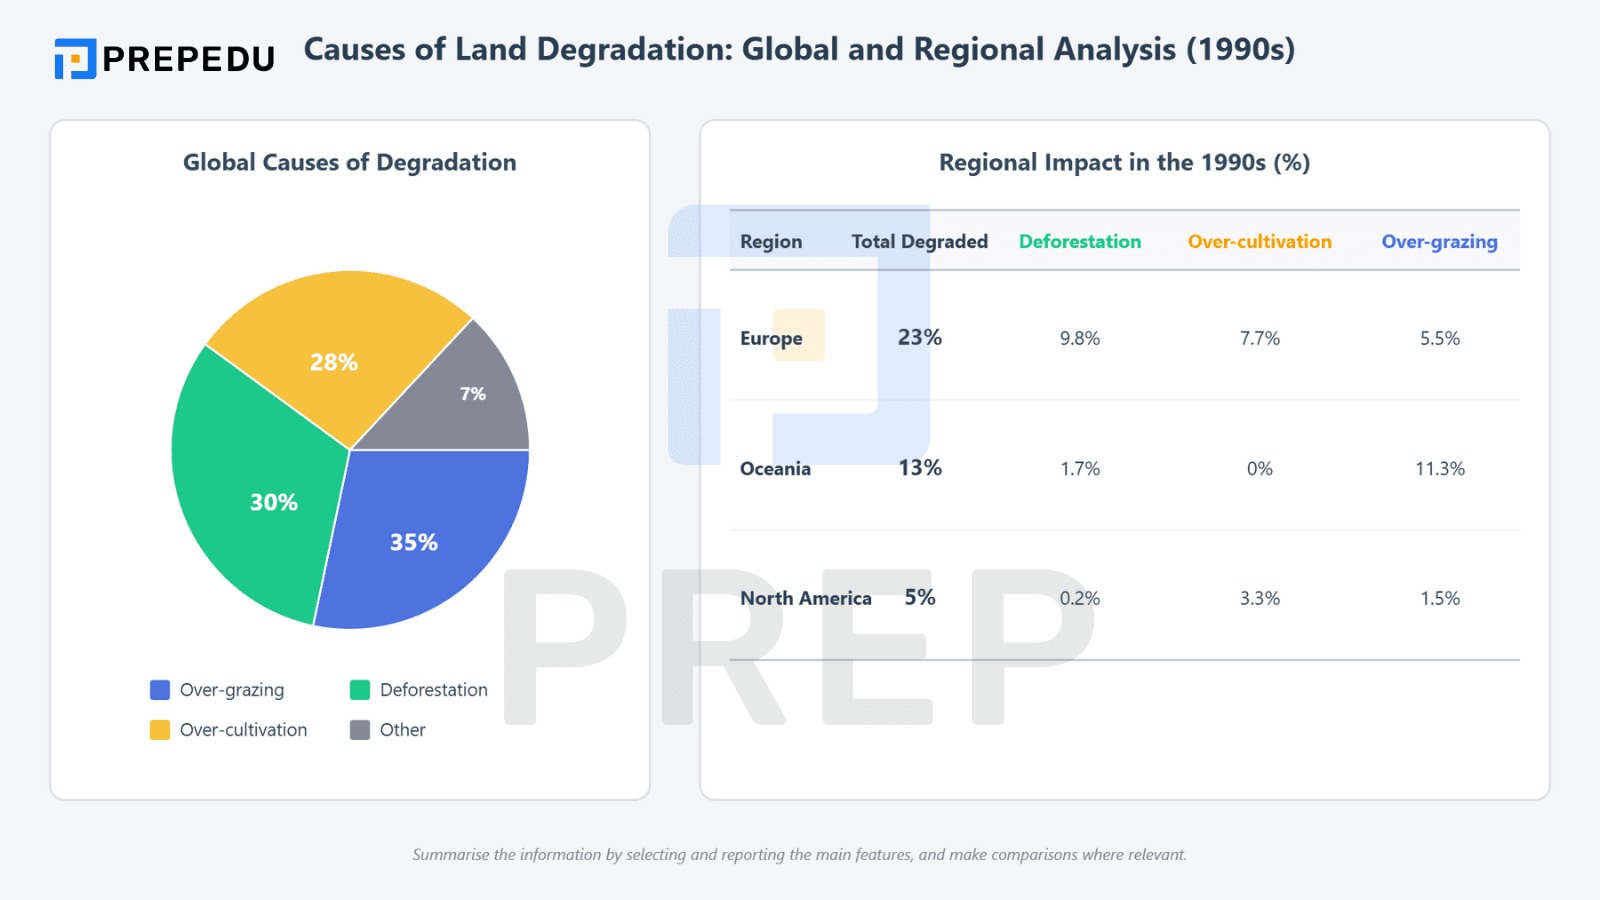
題目(Question):The pie chart shows the main reasons why agricultural land becomes less productive. The table shows how these causes affected three regions during the 1990s. Summarise the information by selecting and reporting the main features, and make comparisons where relevant.
完整範文:
|
The pie chart and table together illustrate the causes of worldwide land degradation and their regional variations during the 1990s. Overall, over-grazing emerged as the primary global cause of land degradation, but regional patterns varied significantly, with Europe experiencing the highest total degradation rate. Additionally, while over-grazing dominated globally, different regions showed distinct vulnerability patterns, with Oceania being most affected by this particular factor. Globally, over-grazing accounted for 35% of land degradation, making it the most critical factor, followed by deforestation at 30% and over-cultivation at 28%. Other causes represented merely 7%, suggesting these three factors dominated the problem worldwide. This concentration indicated that agricultural and forestry practices were the primary drivers of land productivity decline. However, regional data from the table revealed distinct patterns that deviated from global trends. Europe suffered the most severe land degradation at 23% of total land, primarily due to deforestation(9.8%)and over-cultivation(7.7%), while over-grazing played a relatively minor role(5.5%). In stark contrast, Oceania's degradation(13%)was almost entirely attributable to over-grazing(11.3%), with deforestation causing minimal impact(1.7%)and over-cultivation having no effect whatsoever. North America showed the lowest degradation rate at only 5%, with over-cultivation being the dominant factor at 3.3%, followed by over-grazing at 1.5% and deforestation at a negligible 0.2%. These regional variations demonstrate that while over-grazing dominated globally, local agricultural practices and environmental conditions significantly influenced specific regional outcomes. |
|
繁體中文翻譯: 餅圖和表格共同說明了 1990 年代全球土地退化的原因及其區域變化。 整體而言,過度放牧成為全球土地退化的主要原因,但區域模式差異顯著,歐洲經歷了最高的總退化率。此外,雖然過度放牧在全球佔主導地位,但不同地區顯示出不同的脆弱性模式,大洋洲受此特定因素的影響最大。 在全球範圍內,過度放牧佔土地退化的 35%,使其成為最關鍵的因素,其次是森林砍伐(30%)和過度耕作(28%)。其他原因僅佔 7%,顯示這三個因素主導了全球問題。這種集中表明農業和林業實踐是土地生產力下降的主要驅動因素。 然而,表格中的區域數據顯示出與全球趨勢不同的獨特模式。歐洲遭受了最嚴重的土地退化,佔總土地的 23%,主要由於森林砍伐(9.8%)和過度耕作(7.7%),而過度放牧所起的作用相對較小(5.5%)。形成鮮明對比的是,大洋洲的退化(13%)幾乎完全歸因於過度放牧(11.3%),森林砍伐造成的影響很小(1.7%),而過度耕作完全沒有影響。北美顯示出最低的退化率,僅為 5%,過度耕作是主要因素,佔 3.3%,其次是過度放牧(1.5%)和森林砍伐(微不足道的 0.2%)。這些區域變化表明,雖然過度放牧在全球佔主導地位,但當地農業實踐和環境條件顯著影響了特定的區域結果。 |
VII. 考生避坑指南:8 個常見錯誤與解決方案
即使理解了雅思小作文餅圖的寫作技巧,考生仍可能在實際考試中犯下一些典型錯誤而影響分數。以下整理了八個最常見的失分陷阱及其對應的解決策略。
|
錯誤類型 |
常見表現 |
為何失分 |
正確做法 |
|
1. 遺漏 Overview |
直接從 Introduction 進入數據描述,沒有總結段落 |
嚴重影響 Task Achievement,幾乎不可能達到 Band 7 |
在引言後立即撰寫 2-3 句的 Overview,概括主要特徵但不包含具體數字 |
|
2. 過度描述細節 |
逐一描述所有類別,包括不重要的小項目 |
缺乏選擇性,未能突出主要特徵 |
選擇最顯著的數據進行重點描述,相近或不重要的項目可以合併簡述 |
|
3. 缺乏數據支持 |
只說 "X is large" 而不提供具體百分比 |
描述不夠準確和完整 |
始終提供具體數據,如 "X accounts for 35%" 而非僅說 "X is the largest" |
|
4. 單位錯誤 |
混淆 "percent" 和 "percentage",或寫成 "35 percentage" |
語法和詞彙使用不當 |
使用 "35%" 或 "35 percent" 或 "a percentage of 35",但不能說 "35 percentage" |
|
5. 詞彙重覆 |
全文反覆使用 "show, account for, the chart shows" 等相同表達 |
詞彙多樣性不足,限制 LR 分數在 Band 6 以下 |
準備同義詞清單並在寫作中有意識地替換 |
|
6. 英文時態混淆 |
描述過去數據時使用現在式,或在同一段落中混用時態 |
語法錯誤,嚴重影響 GRA 分數 |
根據圖表標示的時間確定時態並保持一致 |
|
7. 缺乏對比 |
僅列出數字而未建立類別之間的關係或比較 |
未完成 "make comparisons where relevant" 的任務要求 |
使用比較級、最高級或對比結構 |
|
8. 個人主觀評論 |
加入 "I think this is good" 或解釋原因 "this is because..." |
Task 1 要求客觀描述而非評論或解釋 |
保持客觀描述,只報告圖表呈現的事實 |
總結
掌握雅思小作文餅圖的寫作技巧需要你理解官方評分標準、熟悉各類題型的應對策略、累積豐富的詞彙和句型,並且通過大量練習將這些知識內化為實際寫作能力。
記住,IELTS Writing Task 1 Pie Chart 的核心任務是客觀、準確、完整地描述圖表呈現的資訊,並在相關處進行有意義的比較。你不需要華麗的辭藻或複雜的句型,而是需要清晰的邏輯、準確的數據和多樣化的表達。
您知道嗎?95% 達到7.0分以上的考生都在考試前用雅思真題練習!PREP的雅思Test Practice提供最真實的模擬考試體驗,擁有數千道來自最新考試的更新題目。AI即時評分、詳細錯誤分析,並提供個人化改進方案。立即登入,免費體驗首次模擬測驗!

你好!我叫黃秋賢,現在在 prepedu.com 擔任內容企劃。我有超過5年的英語與韓語自學經歷,親身備考 IELTS、TOEIC 與 TOPIK,累積了大量第一手的學習者視角——包括哪些語法規則最讓台灣與香港學習者混淆,以及如何在有限的備考時間內最有效地修正這些錯誤。目前已在 prepedu.com 撰寫超過 1000 篇英語學習文章,內容涵蓋語法、詞彙與考試策略,累積協助數千位學習者解決自學過程中的語法疑問。
評論


統一企業編號:202227322W
地址:114 LAVENDER STREET, #11-83 CT HUB 2, SINGAPORE (338729)

