雅思寫作 Task 1 終極指南:9分範例、圖表全攻略與高分詞彙模板

每年數十萬考生在雅思寫作 Task 1 面前止步,明明掌握豐富詞彙卻無法準確描述圖表趨勢,擁有流暢英語卻在20分鐘內寫不出條理清晰的分析。這個看似簡單的「小作文」,實際上是通往理想分數的關鍵門檻,決定著無數學子的留學夢想能否實現。
雅思寫作 Task 1 不僅考驗語言能力,更檢視邏輯思維與資訊整合技巧。掌握 IELTS Writing task 1 的核心方法論,是突破6.5分邁向7分以上的必經之路。
許多考生誤解了雅思小作文的本質,以為只需羅列數據就能獲得高分。事實上,IELTS Writing task 1 技巧遠比表面複雜。成功的作文需要準確識別主要特徵、建立清晰的邏輯架構,並運用多樣化的語言工具進行精準描述。從線圖的趨勢分析到圓餅圖的比例呈現,從地圖題的空間變化到流程圖的步驟描述,每種雅思寫作 task 1 題型都有其獨特的應對策略。
考官評分時,不僅關注任務完成度,更重視連貫性、詞彙豐富度和語法準確性的綜合表現。一個缺乏總覽段落的作文,即使數據描述再詳細也難以超越6分;相反,結構完整、特徵明確的雅思寫作 task 1 範例往往能輕鬆達到7分標準。理解這些評分奧秘,並將其轉化為實用的寫作框架,正是本指南的核心價值所在。
本終極指南將為您提供完整的雅思寫作 task 1 架構解析、9分範例深度剖析,以及涵蓋所有常見題型的高分策略。從基礎概念到進階技巧,從詞彙模板到時間管理,您將獲得通往高分的完整路徑。無論您是初學者還是希望突破瓶頸的進階考生,這份指南都將成為您備考路上最可靠的夥伴。
現在讓我們從雅思寫作 Task 1 的核心概念開始,逐步建構您的高分寫作能力。
I. 深入理解雅思寫作 Task 1 的核心與價值
雅思寫作 Task 1 作為學術組考試的首個挑戰,成為許多考生必須攻克的門檻。這個環節要求考生轉化視覺資訊為精準文字,不僅考驗資料分析能力,更檢視語言表達的準確性與流暢度。無論您的目標分數是何,掌握 IELTS Writing task 1 的基本原則與高分技巧,將為整體寫作表現奠定堅實基礎。讓我們從本質開始,逐步解構這個看似簡單卻蘊含深度的考試環節。

1. Task 1 是什麼?學術組寫作的關鍵第一步
雅思學術組 Task 1(俗稱雅思小作文)要求考生描述並分析給定的視覺資訊,包括圖表、表格、地圖或流程圖。考生需在 20 分鐘內完成至少 150 字的文章,清晰、準確地呈現圖表中的關鍵資訊與主要趨勢。這與普通培訓組(General Training)的 Task 1 書信寫作完全不同,本指南將專注於學術組 IELTS Writing task 1 的系統性指導。
參考更多相關文章:雅思學術組一般組差別 (Academic vs General):完整比較、如何選擇與準備重點
2. 為何 Task 1 對您的雅思總分至關重要
雖然 Task 1 在寫作部分佔分比例僅為 1/3(Task 2 佔 2/3),但它對達成理想總分具有關鍵影響。許多考生錯誤地將精力過度集中於 Task 2,忽視了 Task 1 的基本分數保障作用。事實上,掌握 Task 1 的標準結構與表達方式相對容易,投入適當時間可獲得顯著回報。對目標 7 分以上的考生而言,Task 1 的表現往往決定最終成敗—達到 6.5 分與突破 7 分的細微差別。
3. 掌握四大評分標準:高分藍圖解密
雅思考官評判 Task 1 時,依據四項核心標準進行評分。深入理解這些標準,不僅能指導寫作方向,更能幫助您有的放矢,精準提升分數。
3.1. 任務完成度 (Task Achievement):不只描述,更要回應所有要求
任務完成度評估您是否滿足了基本要求:包含簡明扼要的總覽段落,指出主要特徵;選擇並報告關鍵數據;準確描述趨勢、比較或變化;文章達到最低字數(150字)。高分作文(Band 7-9)必須有清晰、全面的總覽(Overview),不僅列舉數據,更能準確把握整體趨勢。
常見失分點包括:缺乏總覽段落,過度羅列數字而忽略趨勢分析,遺漏圖表中的重要資訊,甚至加入個人解釋或預測(這在 Task 1 中絕對禁止)。任務完成度不僅關乎内容涵蓋的廣度,更重視信息選擇的質量。
3.2. 連貫與銜接 (Coherence and Cohesion):邏輯流暢的秘密
連貫與銜接評估文章的組織結構和邏輯流程。高分作文具備清晰的段落劃分,每段都有明確的中心,段落間轉換自然順暢,並恰當使用連接詞和指代詞。
良好的連貫性表現為:文章結構符合邏輯(如先總覽後細節);段落內部資訊組織合理(如按時間順序或數值大小);避免突兀跳躍或無關資訊插入。高分考生能夠讓讀者感受到「資訊流」的自然流動,無需反覆閱讀即可理解。
3.3. 詞彙資源 (Lexical Resource):精準與多樣性的展現
詞彙資源評估您使用英語詞彙的範圍、準確性和適切性。高分表現包括:使用多樣化且準確的詞彙描述趨勢和數量;靈活運用同義詞避免重複;正確拼寫專業術語;並展現對搭配的準確掌握。
對於 Task 1,您需要掌握一系列描述變化的詞彙(如 increase, decline, fluctuate 等),並能根據變化程度選擇恰當的詞語(如 slight increase 與 dramatic surge 的差異)。Band 7 以上的考生通常能展現出多樣化的表達方式,不依賴簡單、重複的詞彙。
3.4. 文法多樣性與準確性 (Grammatical Range and Accuracy):結構的力量
文法多樣性與準確性評估您運用各種句法結構的能力,以及文法和標點的準確程度。高分表現包括:靈活使用簡單句和複合句;準確運用相關時態(通常為過去時或現在時,視圖表而定);正確使用標點符號;避免主謂不一致等基本錯誤。
值得注意的是,文法的「多樣性」與「準確性」同等重要。僅使用簡單句型雖可確保準確,但難以獲得高分;同樣,過度追求複雜結構而犯錯也會影響評分。理想策略是平衡使用各類句型,確保複雜中不失準確。
II. 雅思寫作 IELTS Writing task 1 架構詳解
掌握雅思寫作 Task 1 的核心標準後,接下來我們將聚焦如何構建一個滿足這些標準的框架。一個清晰、系統的寫作結構是高分的基石,它不僅幫助考官迅速把握您的文章脈絡,更能確保您不遺漏關鍵要素。本節將詳細解析被廣泛認可的四段式結構,並針對每個部分提供實用技巧和範例。
1. 黃金四段論:穩固高分的寫作結構
經過無數高分作文分析,我們發現四段式結構最能滿足 Task 1 的評分要求,提供清晰的邏輯框架。這一結構包括:引言段(Introduction)、總覽段(Overview)和兩個主體段落(Body Paragraphs)。這種結構之所以有效,正是因為它與雅思評分標準高度契合,尤其有助於提升任務完成度和連貫性分數。

1.1. 第一段 (Introduction):精準改寫題目,奠定基礎
引言段的核心目的是轉述題目,告訴考官您理解了任務要求。這一段通常只需一句話,精簡地改寫題目中的關鍵訊息,包括圖表類型、主題和時間範圍(如有)。
有效改寫策略包括:
-
替換詞彙:使用同義詞替換題目中的關鍵詞(如 "shows" → "illustrates")
-
改變句式:將主動句改為被動句,或調整句子結構
-
重新組織信息:調整信息順序,但確保不改變原意
以一個簡單的例子說明:
原題目:The graph below shows the changes in birth rates in China between 1970 and 2010.

改寫方式:The line graph illustrates how birth rates in China fluctuated over a 40-year period from 1970 to 2010.
引言段必須簡潔扼要,避免添加任何不在圖表中的資訊或個人觀點。

1.2. 第二段 (Overview):捕捉靈魂,呈現核心趨勢與特徵(高分關鍵)
總覽段是整篇 Task 1 的靈魂,也是獲得高分的決定性因素。考官明確表示,缺少有效總覽的文章無法獲得 6 分以上的成績。總覽段的目的是提供「鳥瞰視角」,總結圖表中 2-3 個最顯著的特徵或趨勢,而不涉及具體數字。
撰寫有效總覽的關鍵步驟:
-
仔細分析圖表,尋找最明顯的整體趨勢或變化(如長期上升、顯著差異、明確分組)
-
選擇 2-3 個主要特徵,忽略細節和波動
-
使用清晰的總覽標誌詞引導段落(如 "Overall," "In general," "It is clear that")
-
描述這些特徵時保持宏觀視角,不引用具體數據
一個有效總覽的範例:
"Overall, birth rates in China experienced a dramatic decline over the 40-year period, falling from their highest point in the early 1970s to their lowest level in 2010. Additionally, the most significant decrease occurred during the first decade, while the rate of decline slowed considerably after 1980."
高分總覽必須具有概括性(而非選擇性描述),準確性(反映真實趨勢),並保持適當的抽象層次(不陷入細節)。

1.3. 第三、四段 (Body Paragraphs):條理分明,數據支撐細節描述
主體段落的核心目的是提供具體數據和詳細描述,支持總覽中提到的主要趨勢。一個有效的策略是將資訊按邏輯分組,每組佔一個段落。分組方式多種多樣,可根據圖表特性選擇:
按時間劃分(如前半期vs後半期) 按類別劃分(如不同國家、不同產品) 按趨勢劃分(如上升項目vs下降項目) 按重要性劃分(主要特徵vs次要特徵)
每個主體段落應包含:
開頭句指明段落主題或範圍 具體數據點(關鍵年份、最高/最低值、顯著變化) 比較和對比(如適用) 與總覽中提到的趨勢的連接
主體段示例(承接前面的出生率例子):
"Looking at the first two decades, China's birth rate stood at its peak of 2.8 births per woman in 1970 and then fell sharply to 1.5 by 1980, representing a decline of nearly 50% in just ten years. This dramatic decrease continued into the next decade, albeit at a slower pace, reaching 1.2 births per woman by 1990."
有效的主體段落應避免過度羅列數據,而是需要選擇具代表性的數字,並使用適當的連接詞(如 furthermore, in contrast, similarly)確保段落內部流暢連貫。

2. 引言段 (Introduction) 寫作技巧:如何完美轉述 (Paraphrase)?
引言段的成功與否,取決於您的改寫(Paraphrase)能力。以下提供更多元、進階的改寫技巧,幫助您避免直接複製題目而失分:
同義詞替換技巧:建立個人詞庫,為常見 Task 1 詞彙準備同義詞
-
表示「顯示」:show → illustrate, depict, present, demonstrate
-
表示「變化」:change → fluctuation, variation, trend, shift
-
表示「資訊」:information → data, figures, statistics
句式轉換策略:
-
主動↔被動:The graph shows... → ...is shown by the graph
-
名詞化:changed significantly → underwent significant changes
-
句型重組:The graph shows X and Y → X and Y are illustrated in the graph
針對不同圖表類型的引言改寫範例:
-
線圖:The line graph illustrates changes in average house prices across five regions of the UK between 1990 and 2020.
-
柱狀圖:The bar chart compares the amount of water used for agriculture in six countries in 2010.
-
圓餅圖:The pie charts present the breakdown of household expenditure in the UK for two years, 1990 and 2020.
-
地圖:The maps depict the transformation of Meadowside village over a 25-year period from 1995 to 2020.
-
流程圖:The diagram outlines the process of paper recycling from collection to the production of recycled paper products.
引言段寫作的「Do's & Don'ts」:
- 應該做的:保持簡潔(通常一句話即可);確保包含所有關鍵資訊(圖表類型、主題、時間範圍);使用準確的同義詞
- 避免做的:添加不在圖表中的資訊;提出個人解釋或觀點;使用過於花哨或不準確的詞彙;過度複雜化簡單訊息
3. 總覽段 (Overview) 寫作精髓:如何找出並呈現「主要」特徵?
總覽段是 Task 1 中最具挑戰性也最關鍵的部分。培養識別「主要特徵」的能力需要實踐和方法。以下是判斷主要特徵的實用標準:
最顯著的變化或趨勢(最大增長/減少,最明顯波動) 最高和最低點(極值及其出現時間/類別) 整體趨勢(長期方向,如持續上升/下降/波動) 顯著的分組或分類模式(如國家A和B表現相似但與C明顯不同) 重要的轉折點(趨勢反轉,顯著變化開始)
針對不同類型圖表尋找主要特徵的思路:
-
線圖:關注整體趨勢方向、最高/最低點、重要轉折點、不同線條間的比較 “Overall, life expectancy showed an upward trend in all three countries over the period, with Japan consistently maintaining the highest figures. The most significant increase occurred in Brazil, which nearly caught up with the USA by the end of the period.”
-
柱狀圖:關注最高/最低類別、明顯分組、顯著差異、時間變化(如適用) “In general, developed countries consumed significantly more energy per person than developing nations throughout the period. Additionally, while energy consumption increased in all developing countries between 2000 and 2020, it actually decreased in most developed nations.”
-
圓餅圖:關注最大/最小部分、主要變化(如比較兩個時期)、明顯分組 “Overall, entertainment and food remained the two largest expenditure categories in both years, together accounting for over half of total household spending. However, the proportion spent on housing nearly doubled over the 30-year period, while transportation costs showed a marked decrease.”
-
地圖:關注主要建築/自然特徵的變化、整體發展方向、空間布局變化 “In general, the village transformed from a primarily agricultural area to a residential suburb over the 25-year period. The most significant changes include the conversion of farmland in the northern section to a housing estate and the development of commercial facilities along the main road.”
-
流程圖:關注整個過程的起點和終點、主要階段數量、是否循環、關鍵轉換點 「Overall, paper recycling is a cyclical process consisting of six main stages, beginning with the collection of used paper and culminating in the distribution of new recycled products, which eventually re-enter the cycle.」
高質量總覽的核心在於準確識別並清晰表達主要特徵,既不過度簡化也不陷入細節。使用「Overall」或「In general」等標記詞明確標示這是總覽段落,並確保所選特徵確實代表圖表的核心信息。
4. 主體段落 (Body Paragraphs) 策略:如何有效分組與選擇關鍵數據?
主體段落的成功關鍵在於有效的資訊組織和關鍵數據選擇。以下是幾種常用且有效的資訊分組策略:
時間分組:適用於展示時間變化的圖表
-
按等分時期:“The first decade (1990-2000)...”,“The second decade (2000-2010)...”
-
按關鍵轉折:“Before the economic crisis (2000-2007)...”,“After the crisis (2008-2015)...”
-
優點:結構清晰,便於展示時間性變化
類別分組:適用於比較多個項目的圖表
-
按相似表現:“Group A (countries showing increases)...”,“Group B (countries with decreases)...”
-
按重要性:“The three major categories...”,“The remaining minor categories...”
-
優點:便於比較,突出關鍵差異
空間分組:適用於地圖題
-
按方位:“The northern part...”,“The southern section...”
-
按功能:“Residential areas...”,“Commercial developments...”
-
優點:結構符合視覺邏輯,便於讀者跟隨
流程分組:適用於流程圖
-
按階段:“The initial stages...”,“The final processes...”
-
按功能:“The preparation phases...”,“The manufacturing stages...”
-
優點:符合流程邏輯,便於理解過程
選擇關鍵數據的原則:
支撐總覽中提到的趨勢(選擇能證明總覽準確性的數據) 具代表性(選擇極值、轉折點、典型例子) 有比較價值(便於展示差異或相似性的數據點) 避免過度細節(不需要提及每個數據點,選擇最能說明問題的)
關鍵數據呈現技巧:
準確性:數字必須精確,單位標註清楚 簡潔性:避免羅列過多數字,每個要點選擇最具代表性的數據 變化性:描述變化時同時提供絕對值和相對值(如「increased from 20% to 35%, a rise of 15 percentage points」) 比較性:在比較時清晰說明比較對象(如「Country A's figure (65%) was nearly double that of Country B (34%)」)
有效的主體段落能夠在提供足夠細節支持總覽的同時,保持邏輯清晰、重點突出,避免陷入數據的簡單羅列。每個數據點的引入都應該有目的,服務於展示某一特定趨勢或特徵。
III. IELTS Writing task 1題型深度剖析與實戰演練
理論指導固然重要,但真正掌握 ielts writing task 1 技巧需要通過實例學習與分析。本節將提供多個獲得高分評價(Band 9)的雅思寫作 task 1 範例,涵蓋各類常見圖表題型,並進行深度剖析。每個範例都經過精心選擇,代表了雅思寫作的最高標準,並附有詳細解析,幫助您理解為何這些作文能獲得頂級評分。透過分析這些範例,您將看到前面章節中提到的原則和技巧是如何在實際寫作中靈活運用的。
1. 圖表題 (Charts & Graphs) 完全攻略
1.1. 線圖 (Line Graph):趨勢變化的精準描繪 (含範例與逐句解析)
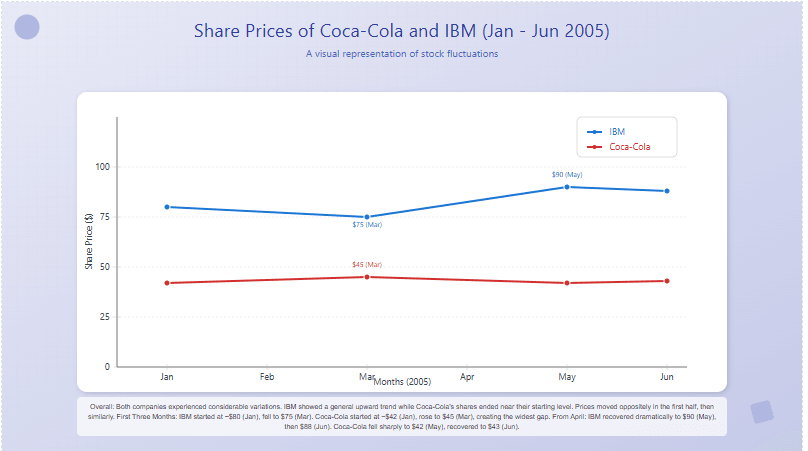
【題目】 The graph below shows the changes in the share prices of Coca-Cola and IBM between January and June 2005. Summarise the information by selecting and reporting the main features, and make comparisons where relevant.
【9分範文】
The line graph illustrates how the share prices of two major companies, Coca-Cola and IBM, fluctuated over the first six months of 2005.
Overall, both companies experienced considerable variations in their share values during this period, with IBM showing a general upward trend while Coca-Cola's shares ended at almost the same level as they began. Additionally, the two companies' share prices moved in opposite directions during the first half of the period before following similar patterns in the latter half.
Examining the first three months, IBM's shares started at approximately $80 in January and declined steadily to reach their lowest point of $75 in March. In contrast, Coca-Cola's shares began at around $42 and rose gradually to peak at $45 in the same month, creating the widest gap between the two companies' values.
From April onwards, the trends changed significantly. IBM's share price recovered dramatically, climbing to $90 by May before experiencing a slight decline to $88 in June. Similarly, Coca-Cola's shares fell sharply to $42 in May before recovering slightly to end at $43 in June, just one dollar higher than their January value.
【逐句解析】
-
引言:成功改寫題目,清楚說明圖表類型(line graph)、主題(share prices of Coca-Cola and IBM)和時間範圍(first six months of 2005)。使用 "illustrates" 替代原題中的 "shows",展現詞彙多樣性。
-
總覽:包含兩個主要特徵 - 整體趨勢對比(IBM上升vs可口可樂基本持平)和走勢關係(前期相反,後期相似)。使用 "Overall" 明確標示這是總覽段落,沒有提及具體數字,保持宏觀視角。
3-4. 主體段:將時間明確分為兩個階段(前三個月和後三個月),每段一個主題。第一段描述前期兩公司相反的走勢,第二段描述後期類似的變化模式。兩段都精選了關鍵數據點(起始值、最高/最低點、結束值),並做了有效比較(使用 "In contrast" 和 "Similarly" 等詞連接)。
此範文展現了:
-
卓越的任務完成度:準確把握並報告主要特徵,提供全面總覽
-
優秀的連貫性:邏輯分段,段落間轉換自然,使用恰當連接詞
-
豐富的詞彙:使用多樣化的趨勢描述詞(fluctuated, variations, declined, rose, recovered, climbing)
-
多樣的句式:既有簡單句,也有複合句和複雜句,表達準確無誤
1.2. 長條圖 (Bar Chart):比較數據的利器 (含範例與逐句解析)
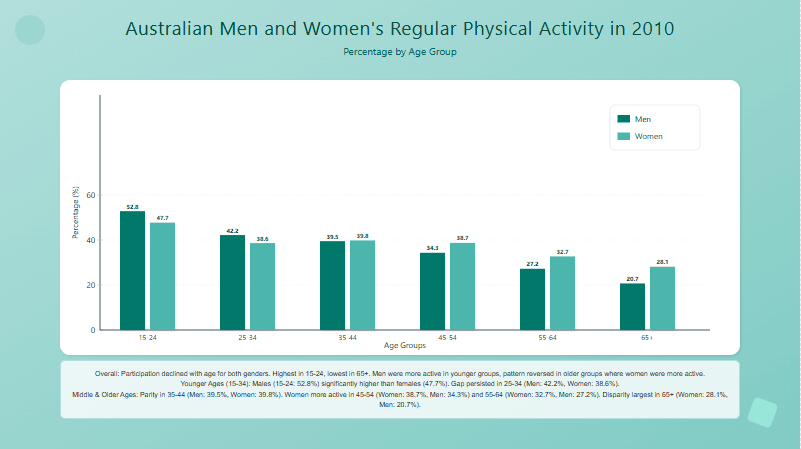
【題目】 The bar chart below shows the percentage of Australian men and women in different age groups who did regular physical activity in 2010. Summarise the information by selecting and reporting the main features, and make comparisons where relevant.
【9分範文】
The bar chart presents data on the proportion of Australian males and females across various age categories who engaged in regular physical exercise in 2010.
Overall, participation in regular physical activity generally declined with age for both genders, with the highest percentages recorded in the youngest age group and the lowest in the oldest category. Interestingly, while men were more physically active than women in the younger age brackets, this pattern reversed in the older age groups, with elderly women showing higher participation rates than their male counterparts.
Among younger Australians aged 15-24, 52.8% of males regularly exercised, significantly higher than females in the same age group (47.7%). This gender gap remained evident in the 25-34 age category, where 42.2% of men compared with 38.6% of women maintained regular physical activity. The participation rates for both genders continued to fall in the middle age groups, reaching approximate parity in the 35-44 bracket (39.5% for men and 39.8% for women).
A notable shift occurred in the older age categories, where women demonstrated higher activity levels than men. In the 45-54 age group, 38.7% of women participated in regular exercise compared to 34.3% of men, and this difference widened further among those aged 55-64 (32.7% for women versus 27.2% for men). The disparity was most pronounced in the oldest age group (65 and over), where despite overall lower participation rates, 28.1% of women remained physically active compared to just 20.7% of men.
【逐句解析】
-
引言:有效改寫題目,準確說明圖表類型(bar chart)、主題(proportion...engaged in regular physical exercise)和研究對象(Australian males and females across various age categories)。使用 "presents data on" 替代 "shows",展現詞彙多樣性。
-
總覽:識別兩個主要趨勢 - 年齡與活動率的反比關係,以及性別參與率的交叉現象(年輕時男性較高,年長時女性較高)。使用 "Overall" 清晰標示,並保持適當抽象層次。
3-4. 主體段:第一段聚焦年輕和中年組(男性參與率較高或相當的年齡段),第二段分析老年組(女性參與率超過男性的年齡段)。每段都包含全面的數據比較,既有同年齡段不同性別的橫向比較,也有跨年齡段的縱向比較。
此範文展現了:
-
優秀的資訊分類能力:按性別參與率的相對高低分組,而非機械地按年齡順序
-
精準的數據選擇:提供每個年齡組的確切百分比,便於準確比較
-
精細的比較語言:使用 "significantly higher," "approximate parity," "widened further," "most pronounced" 等表達量化差異
-
豐富的句式變化:既有陳述基本數據的簡單句,也有解釋趨勢的複合句
1.3. 圓餅圖 (Pie Chart):呈現比例的藝術 (含範例與逐句解析)
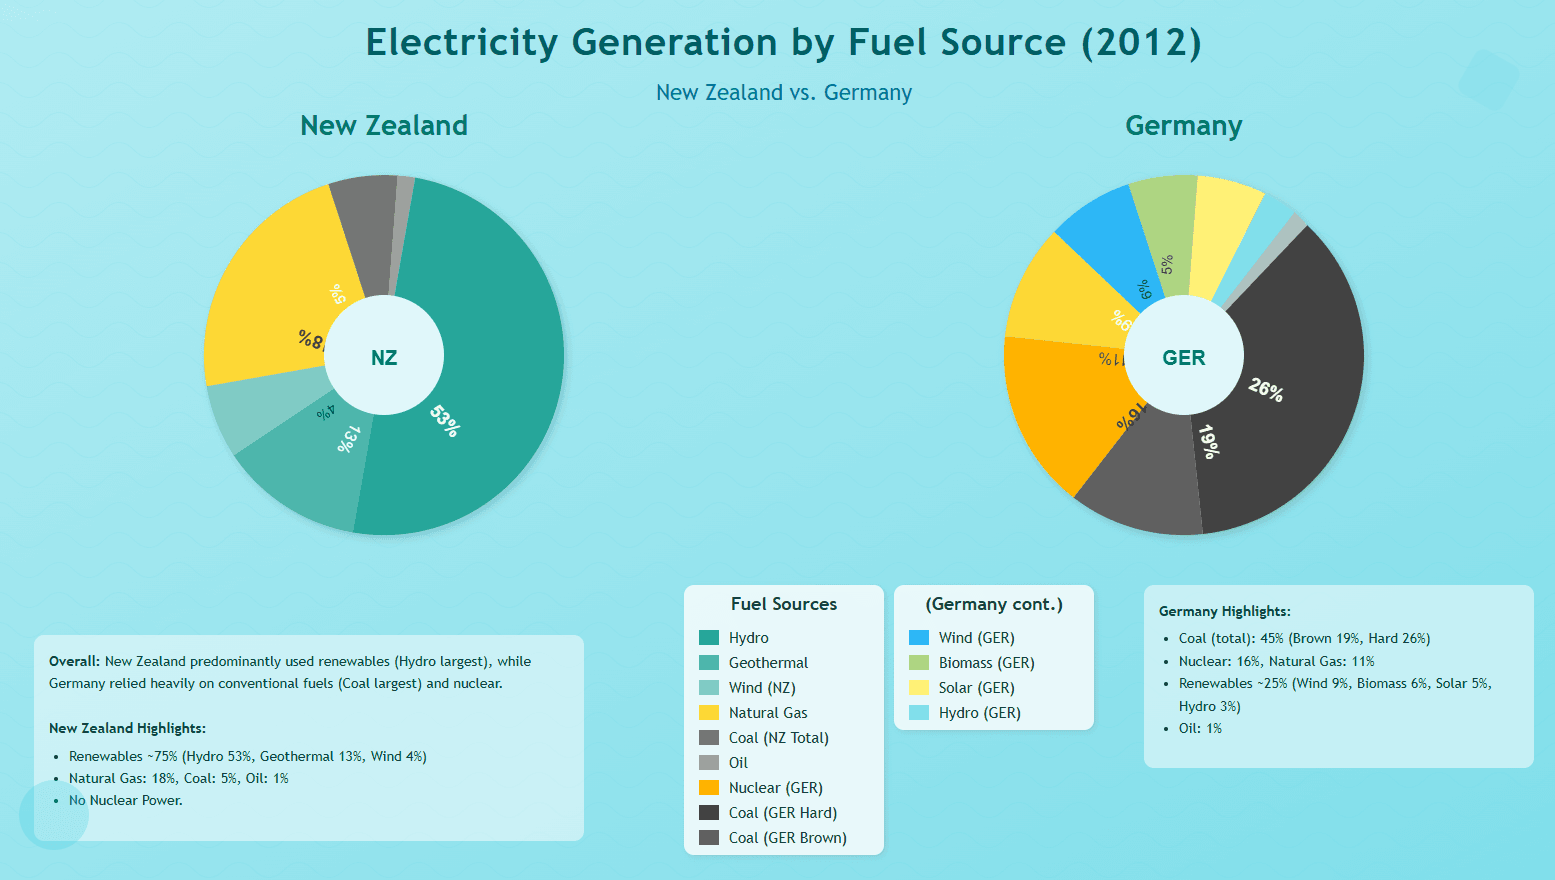
【題目】 The pie charts below show the electricity generation by fuel source in New Zealand and Germany in 2012. Summarise the information by selecting and reporting the main features, and make comparisons where relevant.
【9分範文】
The pie charts illustrate the breakdown of electricity production by different fuel types in New Zealand and Germany during 2012.
Overall, the two countries had starkly different approaches to electricity generation. New Zealand relied predominantly on renewable energy sources, with hydroelectric power constituting the largest share, while Germany depended heavily on conventional fuels, particularly coal. Additionally, nuclear energy formed a significant portion of Germany's electricity mix but was entirely absent in New Zealand.
In New Zealand, renewable sources accounted for approximately three-quarters of the total electricity production. Hydroelectric power was by far the most significant contributor at 53%, followed by geothermal energy at 13% and wind power at 4%. Among conventional sources, natural gas provided 18% of the country's electricity, while coal supplied just 5%. Oil had a negligible contribution at only 1%, and notably, nuclear power was not utilized at all.
Germany's electricity profile presented a sharp contrast, with conventional and nuclear sources dominating the energy mix. Coal was the single largest contributor, responsible for 45% of electricity generation (19% from brown coal and 26% from hard coal). Nuclear energy ranked second at 16%, followed by natural gas at 11%. Renewable sources collectively accounted for approximately one-quarter of Germany's electricity production, with wind being the most significant renewable contributor at 9%, followed by biomass at 6%, solar power at 5%, and hydroelectric at just 3%. Oil, as in New Zealand, played a minimal role at 1%.
【逐句解析】
-
引言:準確改寫題目,清晰說明圖表類型(pie charts)、主題(breakdown of electricity production)和比較對象(New Zealand and Germany)。選擇 "illustrate" 而非 "show",展現詞彙多樣性。
-
總覽:識別兩個關鍵特徵 - 兩國發電方式的顯著差異(可再生能源 vs 傳統能源)和核能使用的差異。使用 "Overall" 明確標示,概括兩國能源政策的根本差異。
3-4. 主體段:第一段專注紐西蘭的能源構成,第二段詳述德國情況,每段都按能源類型的重要性排序。數據呈現精確(提供確切百分比),比較全面(涵蓋所有主要能源類型)。
此範文展現了:
-
優秀的比較能力:不僅提供兩國各自的能源構成,還持續進行跨國比較
-
精確的比例描述:使用 "three-quarters"、"by far the most significant"、"collective" 等表達相對重要性
-
有效的詞彙分類:將能源分為 "renewable"/"conventional" 類別,顯示概念理解
-
強烈的段落層次感:從總體到具體,從主要到次要,結構清晰
1.4. 表格 (Table):處理複雜數據的邏輯 (含範例與逐句解析)
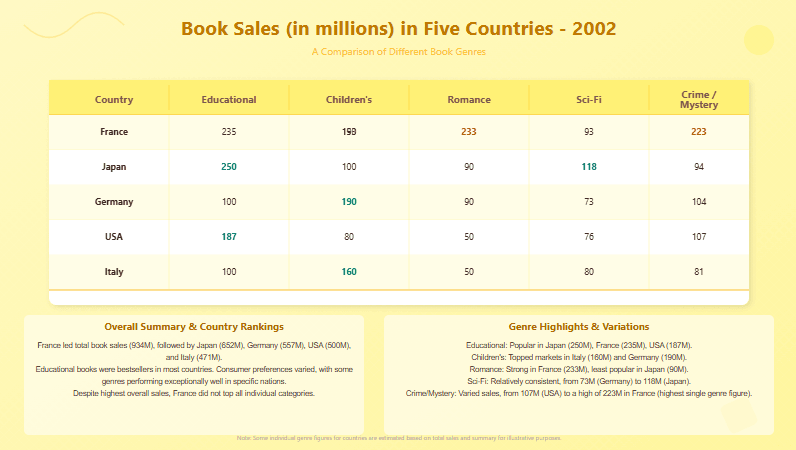
【題目】 The table below shows the sales of different types of books (in millions) in five countries in 2002. Summarise the information by selecting and reporting the main features, and make comparisons where relevant.
【9分範文】
The table presents data on book sales across five different genres in five countries, measured in millions of copies, for the year 2002.
Overall, France led in total book sales among the five nations, while educational books emerged as the bestselling category in most countries. There were also notable variations in consumer preferences across different markets, with certain book genres performing particularly well in specific countries.
France dominated the book market with total sales of 934 million copies, significantly ahead of the second-highest country, Japan, which recorded 652 million sales. Germany (557 million), USA (500 million) and Italy (471 million) followed in descending order. Interestingly, despite having the highest overall sales, France did not lead in all individual categories.
Regarding specific genres, educational books proved most popular in three countries, with sales of 250 million in Japan, 235 million in France, and 187 million in USA. In contrast, Italy and Germany showed different preferences, with children's books topping their markets at 160 million and 190 million copies respectively. Romance novels performed particularly well in France (233 million) but were least popular in Japan (90 million). Science fiction sales were relatively consistent across all countries, ranging from 73 million in Germany to 118 million in Japan, while crime/mystery books showed greater variation, from 107 million in USA to 223 million in France, which represented the highest sales figure for any single genre in any country.
【逐句解析】
-
引言:準確改寫題目,明確表明資料類型(table)、主題(book sales across five genres)、計量單位(millions of copies)和時間(2002)。
-
總覽:識別三個主要特徵 - 法國的整體銷量領先地位、教育類書籍的普遍受歡迎程度,以及各國閱讀偏好的明顯差異。總覽簡潔而全面,涵蓋了表格的核心信息。
3-4. 主體段:第一段從國家角度分析總體銷量排名,第二段從類型角度分析各類書籍在不同國家的表現。兩段都選擇了最具代表性的數據點進行呈現,既有縱向比較(同一國家不同類型),也有橫向比較(不同國家同一類型)。
此範文展現了:
-
優秀的數據組織能力:面對多維度的表格數據(5國 x 5類型),能找出最有意義的比較角度
-
精準的數據選擇:不會機械羅列所有25個數據點,而是選取能說明問題的關鍵數字
-
靈活的比較視角:既從國家層面比較總量,又從類型層面比較細節
-
豐富的比較語言:使用"dominated"、"significantly ahead"、"in descending order"、"proved most popular"等多樣表達
1.5. 混合圖表 (Multiple/Mixed Charts):整合多重資訊的挑戰 (含範例與逐句解析)
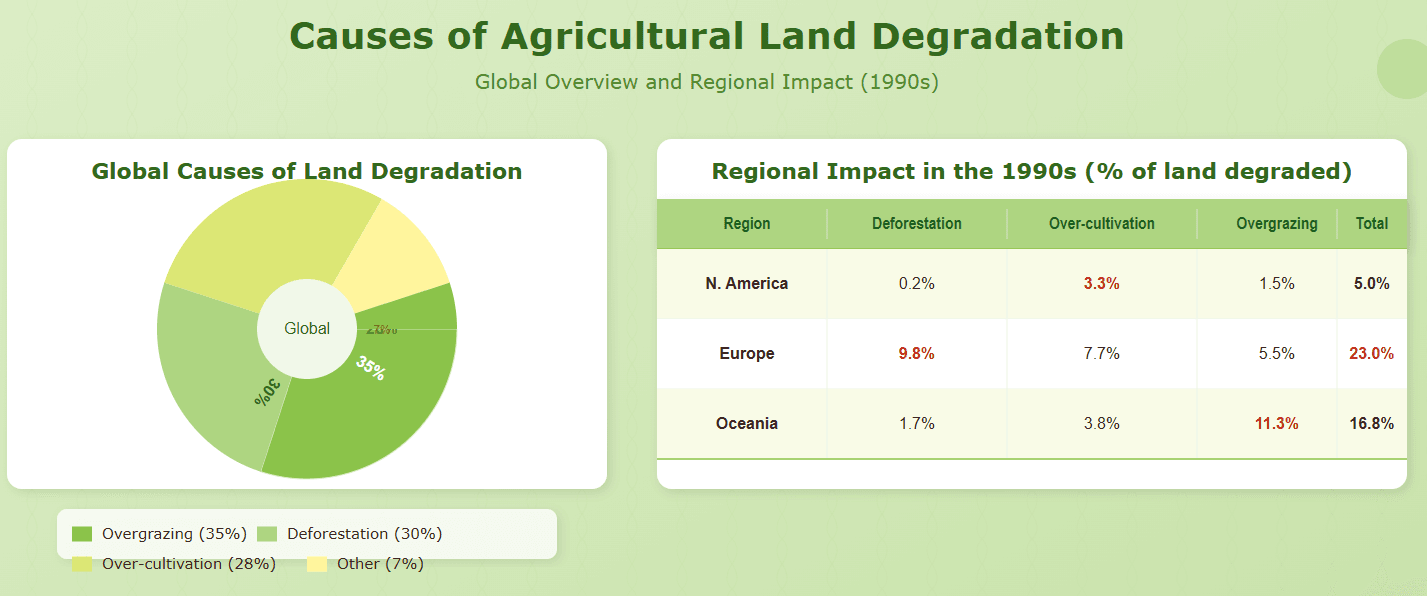
【題目】 The pie chart below shows the main reasons why agricultural land becomes less productive. The table shows how these causes affected three regions of the world during the 1990s. Summarise the information by selecting and reporting the main features, and make comparisons where relevant.
【9分範文】
The pie chart illustrates the primary factors contributing to agricultural land degradation worldwide, while the table provides data on how these factors impacted three global regions during the 1990s.
Overall, overgrazing emerged as the most significant cause of land degradation globally, accounting for approximately one-third of all cases. However, the relative impact of different causes varied considerably across regions, with North America suffering primarily from over-cultivation, while Europe was most affected by deforestation, and Oceania by overgrazing.
According to the pie chart, overgrazing was responsible for 35% of agricultural land degradation worldwide, followed by deforestation at 30%. Over-cultivation contributed to 28% of cases, while other factors collectively accounted for the remaining 7%.
The regional data reveals substantial variations in how these factors affected different parts of the world. In North America, over-cultivation was the predominant issue, damaging 3.3% of all agricultural land during the 1990s, while overgrazing and deforestation affected only 1.5% and 0.2% respectively. By contrast, Europe experienced most severe degradation from deforestation, which impacted 9.8% of agricultural land, significantly higher than the damage caused by overgrazing (5.5%) and over-cultivation (7.7%). In Oceania, overgrazing was by far the most destructive factor, affecting 11.3% of land, compared to only 1.7% for deforestation and 3.8% for over-cultivation. Notably, the total proportion of degraded agricultural land was highest in Europe (23%), followed by Oceania (16.8%) and North America (5%).
【逐句解析】
-
引言:有效改寫題目,清晰說明兩種圖表類型(pie chart and table)、主題(factors contributing to agricultural land degradation)和時間範圍(1990s)。
-
總覽:識別兩個主要特徵 - 過度放牧是全球主要原因,但區域差異顯著(北美主要受過度耕種影響,歐洲主要受森林砍伐影響,大洋洲主要受過度放牧影響)。總覽簡潔而全面,整合了兩個圖表的核心信息。
3-4. 主體段:第一段分析餅圖,呈現全球整體情況;第二段分析表格,比較三個區域的差異。第二段既有橫向比較(同一區域不同原因)也有縱向比較(不同區域同一原因),並在段末總結了受影響最嚴重的區域。
此範文展現了:
-
優秀的整合能力:將餅圖和表格的信息有機結合,而非割裂處理
-
清晰的邏輯結構:從全球到區域,從整體到具體,層次分明
-
精準的數據選擇:提供關鍵百分比,既包括主要因素,也包括總體受影響比例
-
豐富的比較語言:使用"predominant"、"by far the most destructive"、"significantly higher than"等表達相對重要性
2. 地圖題 (Maps) 高分技巧
2.1. 比較型地圖:捕捉變遷的語言 (含範例與空間變化詞彙解析)
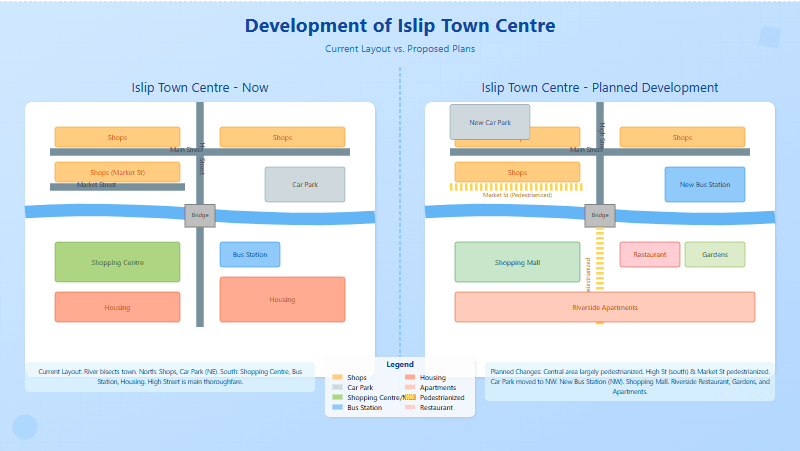
【題目】 The maps below show the centre of a small town called Islip as it is now, and plans for its development. Summarise the information by selecting and reporting the main features, and make comparisons where relevant.
【9分範文】
The maps illustrate the current layout of Islip town centre and the proposed changes planned for future development.
Overall, the town centre will undergo substantial transformation, with a significant reduction in road access and the conversion of the central area into a largely pedestrianized zone. Additionally, while several existing buildings will be repurposed, the fundamental structure of the town centre, including the river and bridge, will remain largely unchanged.
In the present configuration, the town centre is bisected by the river running east to west, with a bridge connecting the northern and southern sectors. The northern area contains predominantly shops along Main Street and Market Street, with a large car park in the northeast. The southern section features several key facilities including a shopping centre, bus station, and housing areas, all accessible via High Street, which runs north-south through the entire town.
According to the development plans, the most dramatic change will be the pedestrianization of most roads in the town centre. High Street will be closed to traffic from the bridge southward, while Market Street will become entirely pedestrianized. The existing car park will be relocated from the northeast to the northwest corner of the town, adjacent to a new bus station that will replace the current one south of the river. The shopping centre will be converted into a shopping mall, while the area previously occupied by the bus station and some housing will be transformed into a riverside restaurant and landscaped gardens. The southern housing area will be expanded and redeveloped as riverside apartments, taking advantage of the waterfront location.
【逐句解析】
-
引言:適當改寫題目,清晰說明圖表類型(maps)、主題(layout of Islip town centre and proposed changes)。
-
總覽:識別三個主要變化特徵 - 道路通行方式的轉變(pedestrianization)、建築用途的變更(repurposing)以及基本結構的保留(river and bridge)。總覽全面概括了變化的本質和範圍。
3-4. 主體段:第一段描述現狀,第二段詳述計劃變更。第一段採用空間順序(從河流開始,分別描述北部和南部),第二段按變化類型和重要性排序(從最顯著的步行化開始,到各個設施的具體變化)。
此範文展現了:
-
優秀的空間描述能力:準確使用方位詞(north, south, east, west)和位置介詞(along, through, adjacent to)
-
精準的變化描述詞彙:使用"pedestrianization"、"relocated"、"converted"、"transformed"、"expanded"等多樣詞彙
-
清晰的對比結構:先現狀後計劃,邏輯清晰
-
豐富的空間關係表達:使用"bisected by"、"connecting"、"runs through"等表達空間布局
特別值得注意的空間變化詞彙:
-
描述位置關係:adjacent to, opposite, across from, surrounding, to the north/south of
-
描述空間布局:layout, configuration, arrangement, situated, located
-
描述變化過程:converted into, transformed into, replaced by, redeveloped as, expanded
2.2. 單一地圖/規劃圖:方位與佈局的描述 (含範例與方位詞解析)
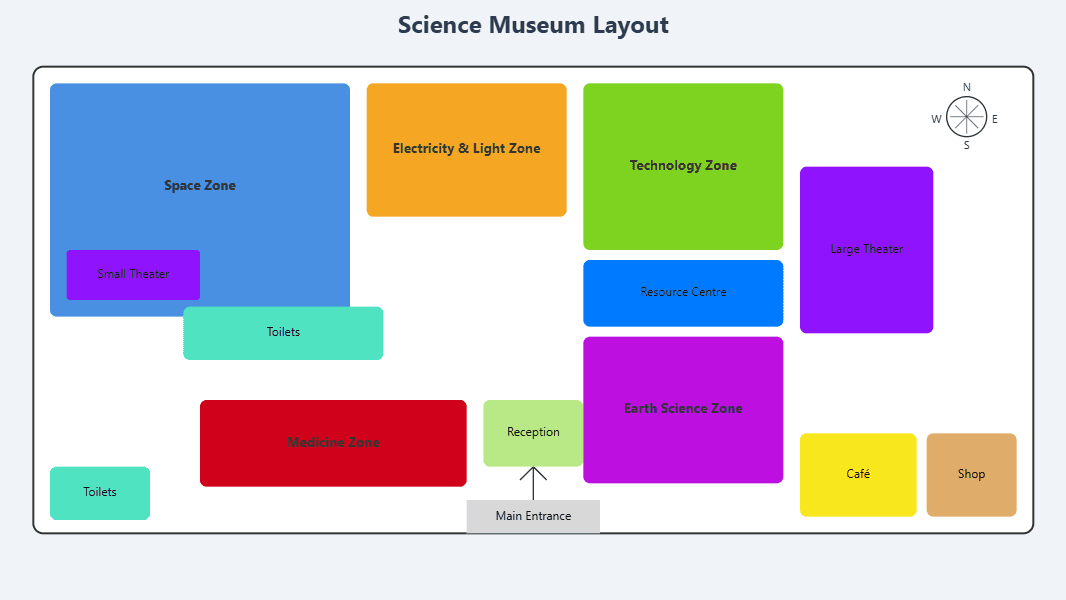
【題目】 The map below shows the layout of a science museum. Summarise the information by selecting and reporting the main features, and make comparisons where relevant.
【9分範文】
The map depicts the internal layout of a science museum, showing the arrangement of exhibition areas and visitor facilities across its premises.
Overall, the museum has a rectangular structure with the main entrance on the south side, leading to a central reception area that provides access to five distinct exhibition zones. Additionally, various visitor amenities are strategically positioned throughout the building, primarily along the southern and eastern sides.
Upon entering from the south, visitors first encounter the reception desk in the centre of the entrance hall. From this central point, they can access the five thematic exhibition areas that occupy most of the museum space. The largest exhibition, the Space Zone, is located in the northwest corner, while the smaller Electricity and Light Zone lies directly east of it. The Technology Zone occupies the northeast section of the building, with the Earth Science Zone situated at its south. The remaining exhibition area, the Medicine Zone, is positioned in the southwest corner, directly west of the reception area.
Regarding visitor facilities, the museum houses a café in the southeast corner, adjacent to a shop selling science-related merchandise. Public toilets are available in two locations: one set near the main entrance on the south side and another between the Space and Electricity zones on the north side. For educational purposes, two theaters are provided – one large theater in the eastern section between the Technology and Earth Science zones, and a smaller one integrated within the Space Zone. Additionally, a resource centre is situated south of the Technology Zone, offering research materials and interactive learning tools for visitors interested in deeper exploration.
【逐句解析】
-
引言:適當改寫題目,清晰說明圖表類型(map)和主題(internal layout of a science museum)。
-
總覽:識別兩個主要特徵 - 博物館的整體結構(rectangular with main entrance on south side)和空間劃分(five distinct exhibition zones and visitor amenities)。總覽提供了建築平面的宏觀視角。
3-4. 主體段:第一段描述展覽區的布局,第二段詳述遊客設施的分佈。第一段採用訪客流動的視角(從入口開始,依次介紹各展區),第二段按設施類型分組(餐飲、廁所、劇場、資源中心)。
此範文展現了:
-
優秀的方位描述能力:精確使用方位詞(northwest corner, directly east, northeast section)描述相對位置
-
清晰的空間導航思路:採用訪客視角描述布局,增強實用性
-
全面的內容涵蓋:不僅描述主要展區,也包括輔助設施
-
邏輯性的分類方法:將空間按功能(展覽區vs訪客設施)而非機械地按位置分類
特別值得注意的方位詞與表達:
-
基本方位詞:north, south, east, west, northeast, southwest
-
具體位置詞:corner, centre, side, section, adjacent to
-
相對位置表達:directly east of, south of, between, within
-
空間組織詞:layout, arrangement, positioned, situated, located
3. 流程圖 (Process Diagrams) 寫作要點
3.1. 製造過程:步驟拆解與被動語態應用 (含範例與順序詞解析)
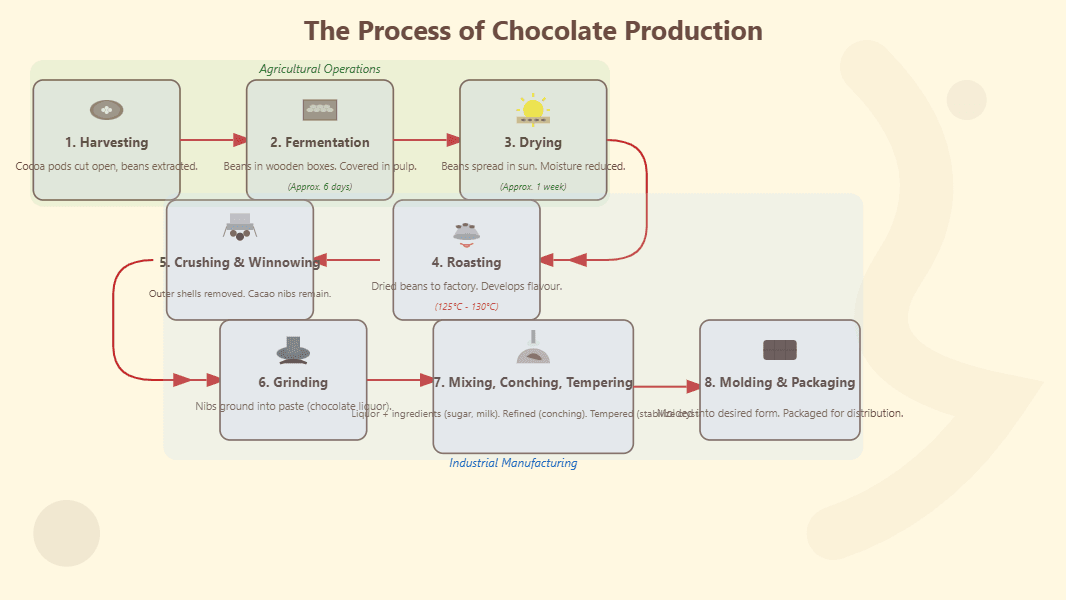
【題目】 The diagram below shows the process of chocolate production. Summarise the information by selecting and reporting the main features, and make comparisons where relevant.
【9分範文】
The diagram illustrates the sequence of stages involved in transforming cocoa beans into chocolate products.
Overall, chocolate production is a complex, multi-stage process consisting of eight main steps, beginning with harvesting cocoa beans and culminating in the packaging of the final chocolate products. The process combines both agricultural operations and industrial manufacturing techniques.
The chocolate production process begins with the harvesting of cocoa pods, which are cut open to extract the beans inside. These beans, covered in a white pulp, are then placed in wooden boxes where they undergo fermentation for approximately six days. Following fermentation, the beans are spread out to dry in the sun for about a week until their moisture content is sufficiently reduced.
Once dried, the beans are transported to factories where the industrial phase of production commences. First, the beans are roasted at high temperatures, typically between 125°C and 130°C, which develops their characteristic chocolate flavour. After roasting, the beans are crushed and winnowed to remove their outer shells, leaving behind the edible cacao nibs. These nibs are then ground into a thick paste known as chocolate liquor. In the final manufacturing stages, this liquor is combined with additional ingredients such as sugar, milk, and cocoa butter in varying proportions depending on the desired type of chocolate. The mixture is then refined through conching—a prolonged mixing and aerating process—before being tempered to stabilize the cocoa butter crystals. Finally, the prepared chocolate is molded into its desired form and packaged for distribution to consumers.
【逐句解析】
-
引言:適當改寫題目,清晰說明圖表類型(diagram)和主題(sequence of stages in chocolate production)。
-
總覽:識別兩個主要特徵 - 過程的複雜性(eight main steps)和過程的性質(combination of agricultural and industrial techniques)。總覽概括了流程的整體結構。
3-4. 主體段:第一段描述農業階段(harvesting to drying),第二段詳述工業階段(roasting to packaging)。兩段都按時間順序描述步驟,清晰標明每個環節的目的和特點。
此範文展現了:
-
優秀的過程描述能力:清晰呈現每個步驟的目的和方法
-
適當的被動語態應用:使用"are cut open"、"are placed"、"are spread out"等被動結構
-
準確的順序詞使用:使用"begins with"、"then"、"following"、"once"、"first"、"after"、"finally"等標示順序
-
專業的技術詞彙:使用"fermentation"、"roasted"、"winnowed"、"conching"、"tempered"等專業術語
特別值得注意的順序詞與表達:
-
標示開始:begins with, commences with, starts with, initially
-
表示過程:then, next, subsequently, following this
-
表示最終:finally, eventually, ultimately, in the final stage
-
表示轉折:once completed, after this stage, following this
3.2. 自然循環:階段描述與連貫性表達 (含範例與循環詞彙解析)
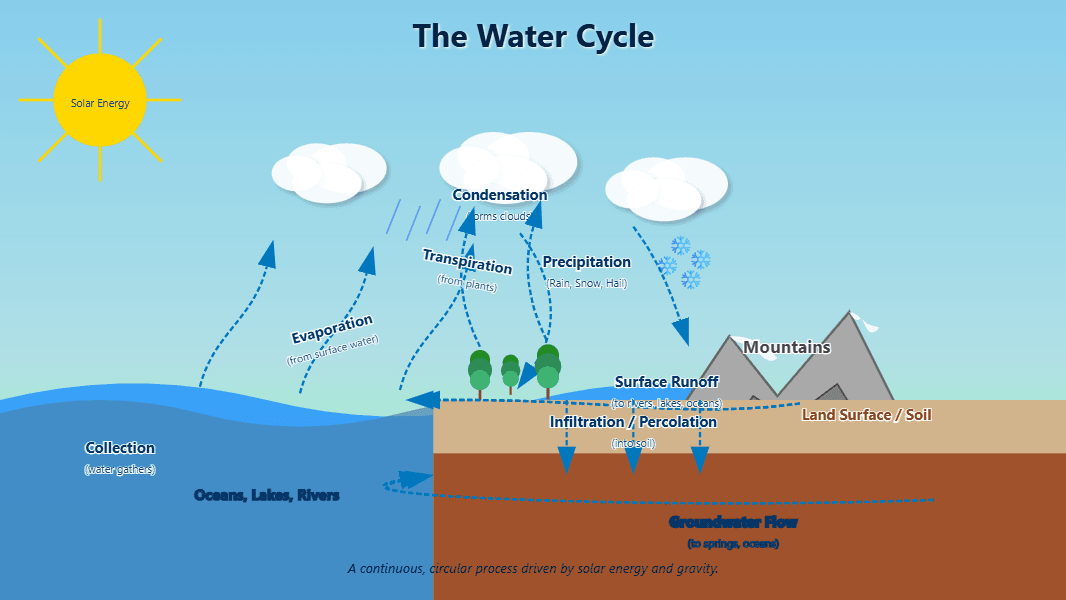
【題目】 The diagram below shows the water cycle. Summarise the information by selecting and reporting the main features, and make comparisons where relevant.
【9分範文】
The diagram illustrates the natural process of the water cycle, depicting how water circulates between the earth's surface and the atmosphere.
Overall, the water cycle is a continuous, circular process with no definitive beginning or end, involving multiple transformations between liquid, vapour, and solid states. The cycle encompasses several key phases including evaporation, condensation, precipitation, and collection, all driven by solar energy and gravity.
The cycle can be understood as beginning with the evaporation of water from oceans, lakes, and rivers, a process powered by heat from the sun. As this water vapour rises into the atmosphere, it cools and undergoes condensation, forming clouds composed of tiny water droplets or ice crystals. When these droplets or crystals become too heavy, they fall to the earth's surface as precipitation in various forms such as rain, snow, or hail, depending on atmospheric temperature conditions.
Upon reaching the earth's surface, the water follows different pathways to complete the cycle. Some precipitation falls directly into oceans and other water bodies, immediately rejoining the main water supply. Other water flows across the land as surface runoff, eventually collecting in rivers that carry it back to the oceans. A portion infiltrates the soil through percolation, either being absorbed by plants (which later release it back into the atmosphere through transpiration) or seeping deeper to replenish groundwater reserves. This groundwater slowly moves through subsurface layers until it eventually resurfaces in springs or reaches the ocean, where the cycle continues uninterrupted. Throughout this perpetual process, water continuously changes form while the total quantity remains constant within the earth's closed system.
【逐句解析】
-
引言:適當改寫題目,清晰說明圖表類型(diagram)和主題(natural process of the water cycle)。
-
總覽:識別三個主要特徵 - 循環的連續性、物質狀態的轉變以及關鍵階段。總覽強調了水循環的循環本質和驅動力。
3-4. 主體段:第一段描述大氣過程(evaporation to precipitation),第二段詳述地表過程(different pathways after precipitation)。兩段按自然邏輯順序描述,強調循環的連續性。
此範文展現了:
-
優秀的循環描述能力:強調過程的連續性和循環性
-
a適當的現在簡單時態使用:使用"evaporates"、"rises"、"cools"等表示常態性過程
-
準確的循環詞彙:使用"continuous"、"circular"、"cycle"、"perpetual"、"uninterrupted"等強調循環本質
-
豐富的過程解釋:不僅描述步驟,還解釋每個步驟的原因和結果
特別值得注意的循環詞彙與表達:
-
描述循環特性:continuous, perpetual, never-ending, ongoing
-
表示重複:repeatedly, continuously, constantly, cyclical
-
表示循環完成:completes the cycle, returns to the starting point, begins anew
-
表示連續性:uninterrupted, without cessation, endlessly
IV. 強化語言武器庫:高分詞彙與句型模板
掌握適當的語言工具對於提升 IELTS Writing task 1 寫作質量至關重要。本節將提供系統化的詞彙庫和句型模板,幫助您豐富語言表達,提高詞彙資源(LR)和語法多樣性(GRA)評分。這些資源按功能和使用場景分類,便於您根據不同題型的需要靈活選用和替換。
1. 描述數據「動態」的進階詞彙
表達數據變化趨勢的能力是 Task 1 成功的關鍵。以下詞彙按變化性質和幅度分類,幫助您精準描述各種趨勢變化。
1.1. 表達上升趨勢 (從微升到飆升)
|
輕微上升 |
中度上升 |
顯著上升 |
劇烈上升 |
|
increase slightly (輕微增加) |
rise steadily (穩步上升) |
grow significantly (顯著增長) |
Soar (飆升) |
|
edge up (輕微上升) |
Climb (上升) |
increase substantially (大幅增加) |
Skyrocket (暴漲) |
|
creep up (慢慢上升) |
go up (上升) |
rise sharply (急劇上升) |
surge dramatically (劇烈上升) |
|
rise marginally (輕微上升) |
increase moderately (適度增加) |
jump considerably (大幅跳升) |
Rocket (飛漲) |
|
show a slight increase (顯示輕微增長) |
grow gradually (漸漸增長) |
increase markedly (顯著增加) |
Explode (爆炸性增長) |
使用範例:
-
The number of tourists increased slightly from 2.1 to 2.3 million between January and February.(旅客人數在一月到二月間從210萬人輕微增加至230萬人。)
-
Internet usage rose steadily throughout the five-year period.(網際網路使用量在五年期間穩步上升。)
-
Sales grew significantly in the fourth quarter, reaching their highest point in December.(銷售在第四季度顯著增長,並在十二月達到最高點。)
-
House prices soared in the capital city, nearly doubling within just three years.(首都的房價飆升,僅在三年內幾乎翻倍。)
注意幅度詞的搭配:上升詞彙可與不同的幅度副詞(slightly, gradually, significantly, dramatically)搭配,創造更精準的表達。
1.2. 表達下降趨勢 (從微降到暴跌)
|
輕微下降 |
中度下降 |
顯著下降 |
劇烈下降 |
|
decrease slightly (輕微下降) |
Decline (下降) |
fall significantly (顯著下降) |
Plummet (暴跌) |
|
Dip (下降) |
Drop (下跌) |
decrease substantially (大幅下降) |
Collapse (崩潰) |
|
edge down (輕微下降) |
Reduce (減少) |
decline sharply (急劇下降) |
Crash (崩盤) |
|
fall marginally (輕微下降) |
decrease gradually (漸漸下降) |
fall considerably (顯著下降) |
Plunge (暴降) |
|
show a slight decrease (顯示輕微下降) |
Sink (沉沒) |
reduce markedly (顯著減少) |
Nosedive (急劇下滑) |
使用範例:
-
Attendance decreased slightly in May, before recovering the following month.(五月的出席人數輕微下降,隨後在下個月回升。)
-
Unemployment rates declined steadily between 2010 and 2015.(2010年到2015年期間,失業率穩步下降。)
-
Oil production fell significantly after the introduction of new regulations.(在新法規推出後,石油生產顯著下降。)
-
Share prices plummeted following the announcement, losing over 30% of their value overnight.(公告發布後,股價暴跌,一夜之間損失超過30%的價值。)
詞性變化:大多數趨勢動詞都有相應的名詞形式,可用於句式變化:
-
The graph shows a sharp increase in population. (名詞)
-
Population increased sharply over the period. (動詞)
1.3. 表達穩定與波動
|
穩定/持平 |
輕微波動 |
顯著波動 |
保持在某水平 |
|
remain stable (保持穩定) |
fluctuate slightly (輕微波動) |
oscillate significantly (顯著波動) |
stand at (站在) |
|
stay constant (保持不變) |
Vary (變動) |
fluctuate wildly (激烈波動) |
level off at (穩定在) |
|
maintain the same level (維持相同水平) |
show minor variations (顯示輕微變化) |
experience dramatic changes (經歷劇變) |
plateau at (穩定在) |
|
remain unchanged (保持不變) |
Waver (擺動) |
swing considerably (大幅波動) |
settle at (穩定於) |
|
hold steady (保持穩定) |
show some instability (顯示一些不穩定性) |
undergo substantial variations (經歷顯著變動) |
stabilize at (穩定在) |
使用範例:
-
Inflation rates remained stable at around 2% throughout the decade.(通脹率在整個十年間保持穩定,約為2%。)
-
Customer satisfaction scores fluctuated slightly between 85% and 88% during the review period.(在回顧期內,顧客滿意度分數在85%到88%之間輕微波動。)
-
Stock prices oscillated significantly in response to market uncertainty.(股價因市場不確定性而顯著波動。)
-
After rising for three consecutive months, unemployment leveled off at 5.2%.(經過連續三個月的上升後,失業率穩定在5.2%。)
2. 精準描述「靜態」比例與數值
描述各種百分比、分數和比例是 Task 1 寫作的基本技能,尤其在處理圓餅圖和比較數據時。
2.1. 百分比、分數與倍數的替換使用
|
百分比表達 |
分數表達 |
倍數表達 |
近似/比較表達 |
|
25 percent |
one-quarter |
a quarter of |
approximately a quarter |
|
33 percent |
one-third |
a third of |
roughly a third |
|
50 percent |
one-half |
half of |
exactly half |
|
67 percent |
two-thirds |
double the amount |
just over two-thirds |
|
75 percent |
three-quarters |
three times as much |
around three-quarters |
使用範例:
-
Manufacturing accounted for 25 percent of the country's GDP.(製造業佔該國GDP的25%。)
-
One-quarter of all respondents expressed dissatisfaction with the service.(四分之一的受訪者表示對服務不滿意。)
-
The leisure category represents approximately a quarter of total household expenditure.(休閒類別約佔家庭總支出的四分之一。)
-
In 2020, the company's profits were double the amount recorded in 2015.(該公司2020年的利潤是2015年的兩倍。)
替換技巧:
-
25% → a quarter → one in four → 1/4
-
50% → half → one in two → 1/2
-
200% → twice as much as → double → two times
2.2. 近似值與極值的表達
|
近似值表達 |
極值表達 |
範圍表達 |
比較表達 |
|
approximately(約) |
peaked at (達到最高點) |
ranged from...to… (範圍從...到... |
higher than (高於) |
|
About (大約) |
reached a maximum of (達到最大值) |
varied between...and… (在...與...之間變化) |
lower than (低於) |
|
Roughly (大致上) |
hit a low of (達到最低點) |
fluctuated from...to… (波動於...到...之間) |
greater than (大於) |
|
Nearly (幾乎) |
bottomed out at (觸底於) |
spanned from...to… (跨越從...到...) |
less than (少於) |
|
just under/over (剛好不到/剛好超過) |
culminated in (最終達到) |
oscillated between...and… (在...與...之間震盪) |
equal to (等於) |
使用範例:
-
The temperature peaked at 38°C in July, the highest recorded that summer.
(七月氣溫達到38°C的最高點,為該夏季最高紀錄。)
-
Population density ranged from 50 to 200 people per square kilometer across the regions.(各地區的人口密度範圍從每平方公里50人到200人不等。)
-
Company A's profits were significantly higher than those of Company B throughout the period.(A公司的利潤在整個期間顯著高於B公司。)
-
Spending on healthcare was just under 10% of GDP, at approximately 9.8%.(醫療保健支出略低於GDP的10%,約為9.8%。)
特殊表達:
-
最小值:the minimum/lowest value, the smallest proportion
-
最大值:the maximum/highest value, the largest proportion
-
平均值:the average/mean value, on average
3. 實現流暢比較的連接詞與句式
有效的比較和對比是 Task 1 寫作的核心要素,尤其在需要描述不同項目、時期或地區之間差異的題目中。
|
相似性比較 |
差異性對比 |
程度比較 |
轉折比較 |
|
Similarly (類似地) |
in contrast (相反地) |
considerably more/less (明顯更多/更少) |
However (然而) |
|
Likewise (同樣地) |
Conversely (反過來說) |
significantly higher/lower (顯著更高/更低) |
on the other hand (另一方面) |
|
in the same way (以相同方式) |
on the contrary (正相反) |
substantially greater/smaller (大幅更大/更小) |
Nevertheless (儘管如此) |
|
Correspondingly (相應地) |
Unlike (不同於) |
far more/less (遠多/少得多) |
despite this (儘管如此) |
|
in a similar manner (以類似方式) |
Whereas (而) |
slightly more/less (稍多/稍少) |
Meanwhile (同時) |
使用範例:
-
The percentage of online shoppers increased in both countries. Similarly, the number of retail stores declined in both regions.(兩國的網上購物者比例均有所增加。同樣地,兩個地區的零售店數量均有所下降。)
-
Men showed a preference for sports programs. In contrast, women preferred documentary channels.(男性偏好體育節目。相反地,女性更喜歡紀錄片頻道。)
-
Country A's expenditure was considerably more than that of Country B in all categories except healthcare.(除醫療保健外,A國在所有類別的支出均明顯高於B國。)
-
The urban population grew steadily throughout the period. However, the rural population experienced a continuous decline.(城市人口在整個期間穩步增長。然而,農村人口持續下降。)
常用比較句型:
-
X was twice/three times as high as Y
-
X accounted for a significantly larger proportion than Y
-
While X remained stable, Y fluctuated considerably
-
The figure for X was substantially higher than that for Y
-
There was a marked contrast between X and Y
4. 地圖題專用空間與變化詞彙庫
地圖題需要特殊的空間描述詞彙和表達方式,以準確描述位置關係和環境變化。
|
方位詞 |
變化動詞 |
地理特徵詞 |
位置關係詞 |
|
north/northern (北方/北部的) |
built/constructed (建造/興建) |
urban area (城市區域) |
adjacent to (鄰近) |
|
south/southern (南方/南部的) |
demolished/removed (拆除/移除) |
rural region (農村地區) |
Opposite (對面) |
|
east/eastern (東方/東部的) |
expanded/extended (擴建/延伸) |
residential zone (住宅區) |
next to (緊鄰) |
|
west/western (西方/西部的) |
renovated/upgraded (翻新/升級) |
commercial district (商業區) |
Between (在…之間) |
|
Northeast (東北方) |
Replaced (替換) |
industrial area (工業區) |
Surrounding (環繞) |
|
Southwest (西南方) |
relocated/moved (搬遷/移動) |
recreational space (休閒空間) |
in the vicinity of (在…附近) |
|
central/center (中心/中央) |
converted/transformed (改建/轉變) |
Waterfront (濱水區) |
to the north/south of (在…的北方/南方) |
使用範例:
-
The hospital was relocated from the city center to the western outskirts of the town.(醫院從市中心搬遷到鎮的西部郊區。)
-
A new shopping mall was constructed adjacent to the train station in the northern district.(一座新的購物中心建在北區火車站旁邊。)
-
The old factory was demolished and replaced by a park, creating a new recreational space for residents.(老工廠被拆除,改建成公園,為居民創造了一個新的休閒空間。)
-
The river flows from the northwest to the southeast, dividing the city into two distinct areas.(河流從西北流向東南,將城市分成兩個不同區域。)
描述地圖變化的關鍵句型:
-
X was replaced by Y
-
X was converted into Y
-
X remained unchanged/intact
-
X was expanded to include Y
-
The area formerly occupied by X became Y
5. 流程圖必備順序與因果連接詞
流程圖寫作需要特定的詞彙來表達步驟順序、因果關係和過程轉換。
|
順序連接詞 |
因果連接詞 |
過程動詞 |
目的表達 |
|
first(ly) |
as a result |
is processed |
in order to |
|
second(ly) |
consequently |
is transported |
so as to |
|
next |
therefore |
is converted |
with the purpose of |
|
then |
thus |
is transformed |
designed to |
|
subsequently |
due to this |
is extracted |
intended for |
|
following this |
because of this |
is manufactured |
aimed at |
|
finally |
this leads to |
is produced |
for the purpose of |
使用範例:
-
First, the raw materials are collected from various sources. Then, they are transported to the factory.
-
The mixture is heated to 100°C. As a result, it changes from a liquid to a gas.
-
The wood is processed to remove impurities so as to improve the quality of the final product.
-
Following this stage, the components are assembled with the purpose of creating the finished product.
流程描述常用句型:
-
The process begins with...
-
X is followed by Y
-
Once X is completed, Y begins
-
After X has been done, Y occurs
-
The final/last stage involves...
-
The process is completed when...
6. 可直接套用的高分句型模板 (分段落功能)
以下提供各段落實用句型模板,但請記住,最佳實踐是理解這些模板的邏輯和結構,然後根據具體題目靈活調整,而非機械套用。
引言段模板:
-
The [chart type] illustrates/presents/depicts [topic] during/in/between [time period if applicable].
-
The [chart type] compares [topic 1] and [topic 2] in terms of [measure] in/during [time period if applicable].
-
The [chart type] shows how [process] is carried out/completed, from [first stage] to [final stage].
-
The [maps/diagrams] demonstrate the changes that occurred in/to [place/subject] between [year 1] and [year 2].
總覽段模板:
-
Overall, it is clear that [main trend 1], while [main trend 2]. Additionally, [main trend 3].
-
In general, [subject] experienced [main pattern], with [notable feature]. Furthermore, [additional important pattern].
-
Overall, the most striking feature is that [key observation]. Moreover, [second key feature] throughout the period/across categories.
-
Looking at the big picture, [subject] underwent [significant change], while [contrasting observation].
主體段開頭模板:
-
Looking at the details of [specific category/time period], it can be seen that [detailed observation].
-
Regarding [specific aspect], [subject] [verb + details], which represents [significance].
-
Turning to [specific category/time period], [subject] [verb + specific detail].
-
With respect to [specific category/aspect], there was [detailed observation].
描述數據模板:
-
[Subject] [increased/decreased] from [number/percentage] in [time period 1] to [number/percentage] in [time period 2].
-
The proportion of [category] [rose/fell] [adverb], reaching [number/percentage] by [time period].
-
[Category A] accounted for [percentage] of the total, while [Category B] represented [percentage].
-
There was a [adjective] [increase/decrease] in [subject], from [starting figure] to [ending figure].
比較模板:
-
While [subject A] [verb] [detail], [subject B] [contrasting verb] [detail].
-
[Subject A] was considerably higher than [subject B], with figures of [value A] and [value B] respectively.
-
The figure for [category A] stood at [value], compared to just [value] for [category B].
-
Unlike [subject A], which [verb + detail], [subject B] [contrasting detail].
結束句模板:
-
By the end of the period, [subject] had [verb + final status], representing [significance].
-
The process is completed when [final stage detail], resulting in [outcome].
-
After all these stages, the final product is [description of end result].
-
These changes resulted in a significantly different [landscape/situation/distribution] compared to the beginning of the period.
這些模板提供了基本框架,但真正的高分作文需要根據特定題目靈活調整詞彙和結構,確保語言自然流暢,而非僵硬套用。
V. 雅思 IELTS Writing task 1 常見錯誤分析與高分衝刺技巧
理論知識和範例分析已經為您提供了扎實的基礎,但要真正在雅思考試中取得高分,還需要了解常見錯誤並掌握一些特定技巧。本節將幫助您識別雅思寫作 task 1 題型中的潛在陷阱,並提供實用的策略來優化您的表現。
1. Task 1 寫作常見錯誤 Checklist (及修正建議)
以下清單列出了考生在 Task 1 寫作中最常犯的錯誤,每項都附有簡要的修正建議,幫助您避免類似問題。
結構性錯誤:
❌ 缺少總覽段落
原因:忽視了 Overview 的重要性,僅羅列數據而未提供整體趨勢。
修正:確保總覽段清晰標示(使用 "Overall" 或 "In general"),並包含 2-3 個主要特徵,不含具體數字。
❌ 寫作太短(未達 150 字)
原因:時間管理不當或對要求理解不足。
修正:確保寫至少 170-190 字,提供足夠內容展示語言能力。練習掌握標準結構所需字數。
❌ 段落劃分不清或段落過多
原因:缺乏清晰的組織思路或過度細分內容。
修正:堅持四段式結構,確保每段有明確主題和功能。
內容性錯誤:
❌ 過度描述數據而忽略趨勢
原因:誤以為 Task 1 要求列出所有數據點。
修正:選擇性描述關鍵數據,重點放在趨勢、模式和顯著特徵上。每個數據應服務於說明某個趨勢。
❌ 添加個人解釋或觀點
原因:混淆 Task 1 和 Task 2 的要求,或試圖"充實"內容。
修正:嚴格限制在圖表提供的信息範圍內,避免解釋原因、預測未來或提供個人評價。
❌ 遺漏重要信息或特徵
原因:分析不全面或注意力偏向某些方面。
修正:系統審題,確保涵蓋所有關鍵元素。使用簡單的審查清單確認是否包含所有主要特徵。
語言性錯誤:
❌ 詞彙重複
原因:缺乏同義詞儲備或未意識到重複問題。
修正:準備描述趨勢、數量和比較的同義詞庫,避免反复使用相同詞彙(尤其是 increase, decrease 等基本詞)。
❌ 時態使用不當
原因:對圖表描述適用時態理解不清。
修正:對過去數據使用過去時,對流程圖通常使用現在時(表示常規過程)。保持時態一致性。
❌ 連接詞使用不足或過度
原因:對英文寫作連貫性要求理解不足或過度依賴連接詞。
修正:恰當使用連接詞建立段落內部和段落間的邏輯關係,但避免每句都以連接詞開始。
❌ 語法錯誤(尤其是主謂不一致)
原因:寫作快速時注意力不集中。
修正:了解常見主謂一致性規則,如集體名詞使用單數動詞。留出時間檢查文法。
策略性錯誤:
❌ 機械套用模板而不調整
原因:過度依賴預先準備的模板。
修正:將模板視為靈活框架,根據具體題目調整詞彙和表達,確保自然連貫。
❌ 過度追求複雜而犧牲準確性
原因:誤以為複雜語言一定獲得高分。
修正:準確性優先於複雜性。只在能確保正確使用的情況下採用高級結構和詞彙。
2. 提升分數的關鍵技巧與策略
掌握以下關鍵技巧將幫助您顯著提高 Task 1 寫作分數,尤其是對於目標 7 分以上的考生。
2.1. 時間管理:20分鐘高效寫作法
雅思考試中,Task 1 分配時間為 20 分鐘,高效的時間分配至關重要:
-
審題與規劃(4-5分鐘):仔細分析圖表,找出主要特徵,規劃段落結構和內容。這個環節至關重要,切勿倉促開始寫作。
-
寫作(12-14分鐘):按照規劃有序完成各段落,保持適當速度。
-
引言段(1-2分鐘)
-
總覽段(3-4分鐘)
-
主體段落(7-8分鐘)
-
-
檢查修正(2-3分鐘):檢查拼寫、語法錯誤和任務完成度,確保達到最低字數要求。
時間管理技巧:
-
使用手錶或考場時鐘監控時間
-
如某部分用時過長,及時調整(寧可簡化某些內容也要完成所有部分)
-
優先確保總覽段完整,其次是主體段的關鍵數據點
2.2. 審題規劃:動筆前的黃金5分鐘
高效的審題和規劃是成功完成 Task 1 的基石:
-
圖表分析要點:
-
確定圖表類型(線圖、柱狀圖、餅圖、表格、地圖、流程圖)
-
識別主題和時間範圍(如有)
-
標記最高點、最低點、顯著變化、明顯差異
-
尋找可能的分組方式(時間、類別、趨勢)
-
-
規劃核心內容:
-
引言:改寫題目的方式
-
總覽:2-3個主要特徵
-
主體段1:具體內容和數據點
-
主體段2:具體內容和數據點
-
-
實用技巧:
-
直接在試卷上標記關鍵數據和特徵
-
簡單列出每段要點,形成寫作框架
-
設想最適合的分組方式(尤其是對複雜圖表)
-
良好的規劃不僅能提高寫作效率,還能確保內容完整度和邏輯性,為高分奠定基礎。
2.3. 檢查修正:不可忽視的最後一步
許多考生忽略檢查環節,但它對分數提升有顯著影響:
-
必檢項目清單:
-
字數是否達標(至少150字)
-
總覽段是否明確且包含主要特徵
-
拼寫(特別是高頻詞如 increase, decrease)
-
文法(主謂一致、時態使用、冠詞)
-
標點(尤其是逗號和句號的使用)
-
-
高效檢查技巧:
-
先檢查整體結構(四段是否齊全)
-
重點檢查容易出錯的數字和單位
-
查看連接詞使用是否適當
-
檢查是否有明顯的詞彙重複
-
即使只有2-3分鐘的檢查時間,也能顯著減少基礎錯誤,提高整體分數。切記,一個簡單但準確的答案通常比一個複雜但錯誤百出的答案得分更高。
VI. 深化 Task 1 理解與應對特殊情況
掌握了 Task 1 的基本理論和技巧後,現在我們來探討一些更深入的問題和特殊情況。這些問題通常來自有經驗的考生,反映了對 Task 1 本質的更深層次思考。通過解答這些問題,我們將幫助您建立更全面、更靈活的應考策略。
1. 何謂真正有意義的「主要特徵」(Overview)?其判斷標準為何?
主要特徵是指能代表圖表整體趨勢或最顯著模式的關鍵點,而非個別數據。判斷標準包括:
- 重要性標準:特徵的重要程度是否足以影響對整體數據的理解。例如,在一個顯示人口增長的線圖中,若某年出現顯著下降,打破了整體上升趨勢,這就是一個主要特徵。
- 普遍性標準:特徵是否適用於圖表的大部分或全部數據。例如,「所有國家的GDP都呈現上升趨勢」比「A國GDP增長了5%」更適合作為主要特徵。
- 對比性標準:特徵是否展現了重要的比較或對比。例如,「發達國家的能源消耗遠高於發展中國家」體現了關鍵類別間的對比。
- 時間性標準(如適用):特徵是否反映了關鍵的時間趨勢或轉折點。例如,「2008年金融危機後,失業率急劇上升」捕捉了重要的時間轉折。
一個有效的主要特徵應該是:
-
可從圖表直接觀察到的(而非推測或解釋)
-
具有一定的抽象程度(概括而非具體)
-
能反映數據的本質或核心意義
-
通常不超過3-4個(太多則失去「主要」的意義)
例如,對於一個顯示五個城市十年溫度變化的線圖,有效的主要特徵可能是「所有城市都經歷了溫度上升」和「南方城市的升溫幅度大於北方城市」,而非「A城市2010年的溫度是25°C」。
2. Task 1 寫作是否絕對不能包含任何推論或個人意見?
是的,Task 1 絕對不應包含任何形式的推論、個人意見或超出圖表數據的解釋。這是 Task 1 與 Task 2 的根本區別之一。
正確做法是客觀描述圖表呈現的事實和數據,不添加任何個人判斷。例如:「失業率在2008年至2010年間從5%上升至10%」是客觀描述。
錯誤做法包括:
-
解釋原因:「失業率上升可能是由於金融危機導致公司大規模裁員」
-
預測未來:「如果這一趨勢持續,預計明年失業率將達到15%」
-
提供建議:「政府應該採取措施刺激就業市場」
-
主觀評價:「這一數據令人擔憂」或「這是一個積極的發展」
這一原則的理由是 Task 1 評估的是您描述和報告視覺信息的能力,而非分析或評價數據的能力。即使您擁有相關專業知識,也應避免引入任何超出圖表範圍的信息。
個別情況下,一些看似是推論的陳述實際上可能是對數據的合理描述。例如,「這表明A比B更受歡迎」,如果圖表明確顯示A的使用率或選擇率高於B,則可以接受。關鍵是確保所有陳述都直接基於圖表提供的數據。
3. 學術組 (Academic) Task 1 與 一般訓練組 (General Training) Task 1 書信寫作的主要差異比較為何?
學術組與一般訓練組的Task 1 在本質上有很大不同,理解這些差異對於準備正確類型的考試至關重要。
|
比較維度 |
學術組 Task 1 |
一般訓練組 Task 1 |
|
任務類型 |
描述視覺信息(圖表、表格、地圖、流程圖) |
寫信(正式、半正式或非正式書信) |
|
寫作目的 |
客觀報告和描述數據 |
溝通、請求、投訴、道歉等社交或商務目的 |
|
語言風格 |
學術、客觀、描述性 |
根據情境變化(正式商務語言到友好日常語言) |
|
結構要求 |
固定四段式:引言、總覽、兩個主體段 |
靈活的信件格式:稱呼、主體、結束語 |
|
評分重點 |
數據描述準確性、趨勢識別能力、學術用語 |
溝通效果、語調適當性、目的達成度 |
|
詞彙特點 |
統計描述詞、比較詞、趨勢詞彙 |
問候語、請求用語、感謝表達、客套話 |
|
常見挑戰 |
識別主要特徵、準確描述數據關係 |
把握適當語調、遵循信件格式規範 |
儘管兩種任務截然不同,但評分標準的基本框架(任務完成度、連貫性、詞彙資源、語法多樣性)是相同的。不同的是這些標準在具體任務中的體現方式。
一個值得注意的共同點是:兩種任務都要求在20分鐘內完成至少150字的寫作。然而,一般訓練組的Task 1通常更容易獲得較高分數,因為日常書信寫作往往比客觀描述圖表信息更符合大多數考生的日常語言使用習慣。
4. [分組型問題] 除了常見圖表,Task 1 可能出現哪些較少見或組合型的視覺資訊類型?該如何應對?
雖然大多數 Task 1 題目涉及標準圖表類型,但考試有時會出現一些較少見或複雜的視覺信息類型,考生需要有應對策略:
較少見的視覺信息類型:
-
多重圖表組合:同時呈現不同類型的圖表(如線圖+餅圖)
-
複雜流程圖:包含多個分支或循環的製造或自然過程
-
3D或多層級地圖:顯示不同時期的多層變化
-
特殊網絡圖:如組織結構圖、系統連接圖
-
複雜科學圖表:如生命週期、生態系統圖解
-
多時期對比圖:三個或更多時間點的對比
-
分層柱狀圖:在同一柱子中顯示不同組成部分
-
氣泡圖:使用圓的大小表示第三個變量
應對策略:
-
回歸基本原則:無論圖表多麼複雜,基本的四段式結構和分析方法仍然適用。
-
仔細審題:花更多時間理解圖表的組織方式和所表達的內容關係。識別不同圖表之間的連接點或共同主題。
-
簡化複雜性:將複雜圖表分解為可管理的部分。例如,將多重圖表視為相關但獨立的數據集。
-
整合分析:尋找不同圖表或圖表部分之間的關聯。總覽段應該整合所有圖表的主要發現。
-
保持選擇性:面對信息量大的複雜圖表,更需要有選擇地報告最重要的特徵,而非試圖涵蓋所有細節。
-
靈活分組:可能需要調整標準的分組方法。例如,對於多重圖表,可以每個主體段處理一個圖表,或按共同主題將不同圖表的相關部分分組。
例如,如果題目同時提供了一個顯示人口年齡分佈的餅圖和一個顯示不同年齡組就業率的柱狀圖,您可以在總覽中整合兩者的關鍵發現(如「年輕人口比例高但就業率低」),然後在主體段中分別詳述每個圖表,同時建立它們之間的聯繫。
5. [定義型問題] 多少字數才算是「恰當」而非「冗長」?(超越150字門檻的迷思)
關於 Task 1 的理想字數,存在許多誤解。雖然官方要求至少寫150字,但這只是最低門檻,而非目標字數。
理想字數範圍為 170-220 字。這個範圍通常能夠:
-
提供足夠空間完整描述主要特徵和關鍵數據
-
展示適當的語言多樣性和組織能力
-
避免過度冗長或不必要的重複
字數過少的問題(僅150字左右):
-
可能無法充分展示語言多樣性
-
難以涵蓋所有主要特徵
-
可能給人匆忙完成的印象
字數過多的問題(超過240字):
-
可能導致不必要的重複或冗餘
-
增加出錯風險
-
浪費寶貴時間(影響Task 2完成質量)
影響「適當」字數的因素包括:
-
圖表複雜度:複雜的多重圖表可能需要稍多字數
-
語言效率:精煉的表達可以在較少字數內傳達相同信息
-
內容選擇:關注主要特徵而非枚舉所有數據點可減少所需字數
關鍵在於內容質量而非數量。一篇200字的作文若涵蓋所有主要特徵並使用精確多樣的語言,遠勝於一篇250字但充斥重複和不必要細節的作文。
實用建議:在練習中,嘗試控制在180-200字範圍內完成一個標準Task 1題目,這有助於培養精煉表達和關鍵信息選擇的能力。
6. [是非型問題] 使用模板是否會導致低分?(如何正確、靈活地運用模板)
使用模板本身並不會直接導致低分,但不當使用模板確實可能影響分數。這個問題需要辯證看待。
模板使用的潛在問題:
-
僵化套用:機械地套用固定表達而不根據具體題目調整,導致不自然或不適合的表達。
-
語言不自然:過度依賴預設句式可能導致整體語言缺乏自然流暢感,給人「背誦」的印象。
-
忽視具體內容:專注於填充模板框架而非真正分析和描述圖表的主要特徵。
-
評分風險:考官熟悉常見模板,若發現整篇文章明顯套用模板,可能對語言真實能力產生質疑。
正確使用模板的方法:
-
將模板視為框架而非公式:理解模板的基本結構和目的,但允許靈活變化。
-
個性化調整:根據具體題目修改關鍵詞和表達方式,確保語言與內容自然匹配。
-
多樣化句式和連接詞:即使使用模板結構,也應變換句式和連接詞,避免機械重複。
-
關注內容而非形式:模板只應服務於更有效地組織和表達內容,而非取代對內容的思考。
實用平衡策略:
-
將模板作為學習階段的輔助工具,幫助理解基本結構和要求
-
通過大量練習內化模板的核心原則,逐漸發展個人的自然表達
-
保留一些通用性較強的句式(如總覽標記語 "Overall,"),但確保其他部分根據具體內容靈活表達
-
練習多種表達方式,即使描述相似情況也能用不同方式表達
最佳實踐是從模板中學習,而後超越模板 — 理解其背後的原則和目的,然後發展出更自然、個性化但仍然符合評分標準的寫作風格。
VII. 精通雅思小作文的終點線
經過深入學習雅思寫作 Task 1 的核心要點、結構框架、語言技巧和常見問題,我們現在來到了學習旅程的總結階段。成功掌握雅思小作文不是終點,而是開啟更廣闊語言表達能力的起點。
從今天開始,將本指南的知識轉化為實際練習,一步步構建您的 Task 1 寫作能力,相信通過持續努力,您必將在雅思考試中展現出色的表現並達成目標分數。祝您備考順利,考試成功!
透過 Prep 的獨家 AI,在家輕鬆規劃雅思學習路線!您可線上自主學習高品質雅思課程,並享受 AI 的詳細批改與智慧練習。
點擊此處立即註冊並獲得諮詢!
現在就下載 PREP App,體驗在家線上學習,穩步邁向雅思目標,並在 Teacher Bee AI 的幫助下即時解決所有疑問。

你好!我叫黃秋賢,現在在 prepedu.com 擔任內容企劃。我有超過5年的英語與韓語自學經歷,親身備考 IELTS、TOEIC 與 TOPIK,累積了大量第一手的學習者視角——包括哪些語法規則最讓台灣與香港學習者混淆,以及如何在有限的備考時間內最有效地修正這些錯誤。目前已在 prepedu.com 撰寫超過 1000 篇英語學習文章,內容涵蓋語法、詞彙與考試策略,累積協助數千位學習者解決自學過程中的語法疑問。
評論


統一企業編號:202227322W
地址:114 LAVENDER STREET, #11-83 CT HUB 2, SINGAPORE (338729)

