IELTS Task 1: Describe a University Library Survey
This guide explains how to describe a university library survey in IELTS Writing Task 1 by identifying key findings, structuring your report effectively, and applying the correct grammar and vocabulary. You will also see Band 6 and Band 8 outlines, along with common mistakes and practical strategies to improve clarity.
I. Understanding the University Library Survey in IELTS Task 1
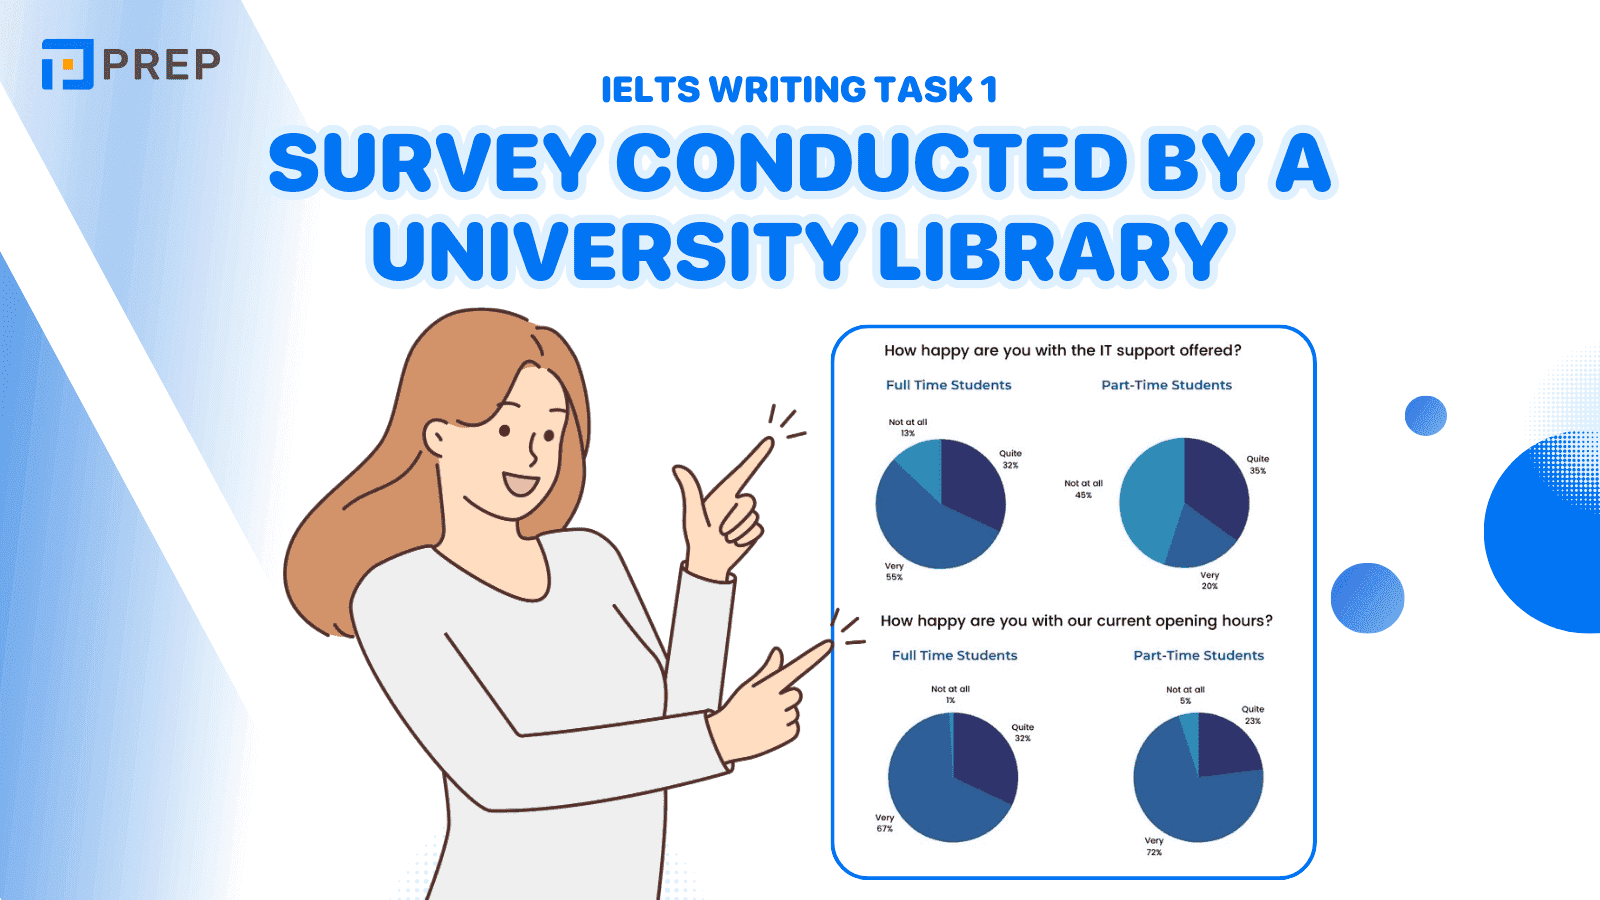
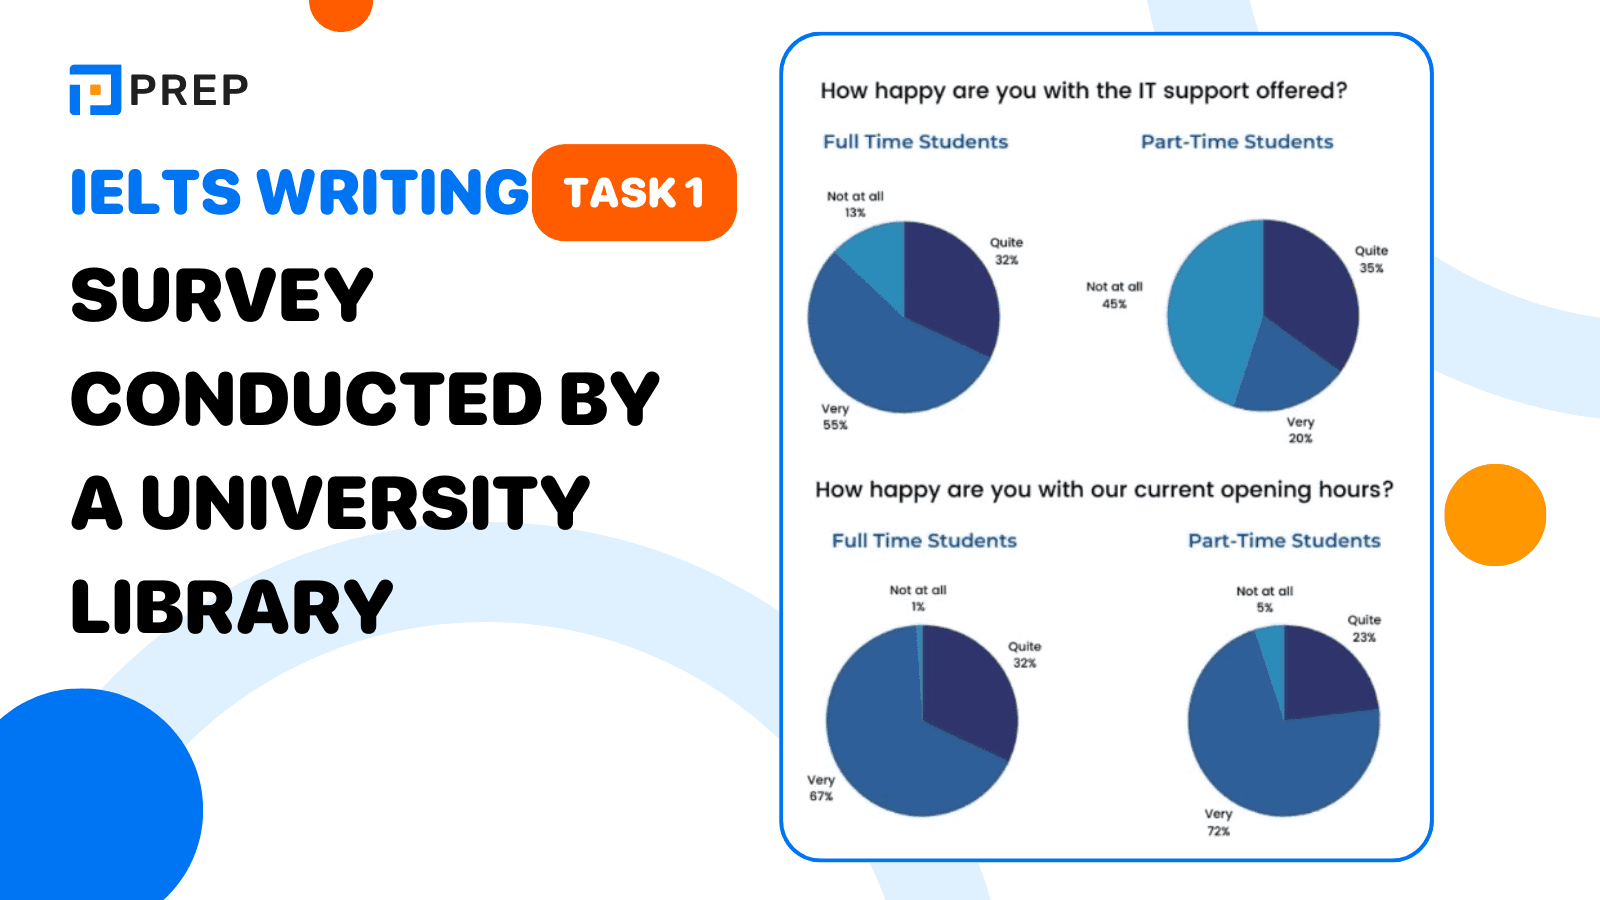
Survey-based questions in IELTS Writing Task 1 are designed to test how effectively you can interpret and describe data collected from participants, usually shown in a bar chart, pie chart, or table. When the data come from a university library’s survey, the chart typically presents student or staff feedback on various aspects of library services, usage habits, or satisfaction ratings. Your goal is to report the most significant findings clearly, objectively, and in a structured manner.
What the Survey Chart Shows
The chart usually illustrates responses collected from a group of participants—such as undergraduate students, postgraduates, or faculty members—based on a set of criteria related to library features or services. These features might include:
-
Quality of borrowing services
-
Helpfulness of library staff
-
Digital resources
-
Study space availability
-
Overall satisfaction
It is essential to identify the measured variables, categories, and units of measurement (e.g. percentage of satisfaction, number of respondents, rating scales). Some charts may compare multiple user groups side-by-side.
Before writing, take time to observe:
-
How many categories of service are being evaluated
-
Which items are most or least highly rated
-
Whether the survey includes contrasting opinions from different demographic groups
Understanding common IELTS writing task 1 question types helps candidates quickly recognize survey charts and adjust their writing approach accordingly.
Key Findings You Must Identify Before You Write
Writing a coherent response starts with detecting the most prominent patterns. Examiners expect you to report general trends, not to list every number. Focus on:
-
The highest and lowest rated features
-
Any services rated similarly
-
Significant gaps or striking contrasts between user groups
Avoid the trap of narrating every figure. Instead, try to group related data together based on trends or values.
For example:
“Both undergraduate and postgraduate students rated online resources highly, while physical borrowing services received comparatively lower satisfaction across all groups.”
This approach shows that you understand the data’s overall meaning, not just the numbers.
This requirement highlights the importance of writing a clear IELTS writing task 1 overview that summarizes the main patterns without detailed figures.
How to Interpret Survey Results in Academic Writing
Good Task 1 writing uses objective, formal language and avoids personal opinions or casual wording. Here are key principles for interpreting survey charts in an academic tone:
-
Avoid subjective language: Do not say "I think the digital library is useful".
-
Use comparative forms and trend-focused expressions:
“The majority of respondents selected...”,
“A significantly smaller percentage rated staff support positively.” -
Be cautious with speculation: Do not explain why survey participants expressed certain preferences unless the chart explicitly says so.
Also, always remember to avoid copying phrases directly from the task prompt. A proper introduction and paraphrased overview show your ability to rephrase in academic English.
II. How to Structure Your Task 1 Answer for a Survey Chart
Describing a survey chart clearly and logically in IELTS Writing Task 1 requires more than just listing numbers. A high-scoring response needs a clear structure, proper grammar, and academic vocabulary. Whether the chart is a bar graph, pie chart, or table showing the results of a university library survey, your writing should follow a consistent and organized format.
Standard IELTS Task 1 Structure: Introduction – Overview – Body Paragraphs
Most successful Task 1 essays follow a four-paragraph structure:
-
Introduction
-
Paraphrase the task question.
-
Mention what the survey measured and who the respondents were.
-
-
Example:
“The chart illustrates the results of a survey conducted by a university library to evaluate users’ satisfaction with various services.” -
Overview
-
Summarize the most general trends or key comparisons.
-
Do not include specific data here.
-
Focus on what stands out (e.g. the most and least highly rated features).
-
-
Example:
“Overall, online research tools were the most positively rated service, while physical borrowing options received lower levels of satisfaction.” -
Body Paragraph 1
-
Group related details or highlight a particular pattern.
-
Focus on a subset of services or one group of respondents (e.g. undergraduates).
-
-
Body Paragraph 2
-
Describe the remaining data.
-
Compare user groups if applicable, or highlight other key differences.
-
This paragraphing approach ensures that your answer is not just a list of statistics but instead a clear comparison of the survey’s outcomes.
For survey data presented visually, guidance from pie chart in IELTS Writing Task 1 can help you describe proportions accurately.
Grammatical Rules for Describing Survey Results
Grammar is a key scoring criterion in Task 1, and to meet Band 7 or higher, your writing should demonstrate range and accuracy. Here are key rules when describing a survey chart:
-
Use the present simple tense, since the chart typically represents factual data and summaries.
Example: "More than 60% of postgraduates report high satisfaction." -
Use passive voice only if it fits naturally into the sentence. For surveys, active forms are generally clearer.
Example: "The survey shows…" or "Respondents rated..." -
Use comparative forms correctly:
“more satisfied than,” “less popular than,” “the highest-rated service.” -
Avoid using informal expressions or questions. The tone should remain formal and objective.
-
Don’t speculate or explain reasons unless the data gives a specific indication.
Useful Vocabulary and Linking Expressions for Survey-Based Writing
Here is a selection of vocabulary and phrases you can use to describe survey charts more effectively:
Vocabulary by function:
|
Function |
Examples |
|
Describing quantities |
a majority of, a minority of, a small fraction, nearly half |
|
Expressing ranking |
the most preferred, the least popular, the highest-rated |
|
General findings |
according to the results, the survey indicates, respondents reported |
|
Describing similar data |
both groups, similarly, nearly the same percentage |
|
Highlighting contrast |
while, whereas, in contrast, compared to |
Sample sentence patterns:
-
“A greater proportion of undergraduates reported satisfaction with digital services than with physical lending.”
-
“Whereas 75% of staff were satisfied with research tools, only 52% rated the help desk positively.”
Using a variety of these expressions will help your writing sound more academic, analytical, and fluent—which directly supports a higher score in Coherence & Cohesion and Lexical Resource.
Mastering these skills has a direct impact on IELTS writing band scores, especially in Task Achievement and Coherence.
III. Practical Examples: Band 6 vs Band 8 Survey Descriptions
One of the most effective ways to improve your IELTS Writing Task 1 score is to compare high- and low-band responses to the same question. This not only highlights what examiners are looking for, but also shows common weaknesses that learners can fix. The following examples are based on a typical survey chart showing the opinions of university students on various library services.

Key Differences Between Band 6 and Band 8 Responses
|
Criteria |
Band 6 Response |
Band 8 Response |
|
Task Achievement |
Describes some data but fails to group or highlight key comparisons |
Covers all key features; groups and summarizes trends effectively |
|
Coherence & Cohesion |
Sentences may be disconnected or overly basic |
Clear paragraphing and strong use of linking devices |
|
Lexical Resource |
Limited range; frequent repetition of basic words |
Wide variety of vocabulary, including topic-specific terms |
|
Grammatical Range |
Simple or repetitive structures; frequent errors |
Wide range including comparatives, passives, and compound clauses – mostly accurate |
Band 6 Sample Outline and Paragraph
-
Question (paraphrased): The chart shows the results of a survey on student satisfaction with five library services at a university.
-
Overview Summary: Some services were rated higher than others. Online resources were liked the most.
Sample (Band 6 Body Paragraph):
Borrowing books had 65% satisfaction. The help desk and digital resources both had around 80%. Facilities like study rooms had 55%. The worst was group study spaces, which only had 40% satisfaction. So, students liked digital resources the best. Other services were average or lower.
Main Issues:
-
No grouping or analysis—just a list of numbers.
-
Basic sentence structure and limited vocabulary.
-
Weak or missing comparison between categories.
-
Lacks effective transitions.
Why Band 6?
While the basic data is correct, the report lacks cohesion, variety in grammar, and analytical thinking. The information is presented with minimal structure.
Band 8 Sample Outline and Paragraph
-
Overview Summary: The majority of students were satisfied with digital services, while facilities for group study received the lowest ratings overall.
Sample (Band 8 Body Paragraph):
Overall, digital resources and the general help desk received the highest levels of satisfaction, both at approximately 80%. In contrast, group study areas were the least well-rated, with only 40% of students expressing satisfaction. Borrowing services also scored fairly well, with two-thirds of users reporting a positive experience, while study space availability fell below expectations, at just over 50%.
Why This is Band 8:
-
Clear grouping (best-rated vs. least-rated services).
-
Uses comparatives (“higher than,” “in contrast,” “also scored fairly well”).
-
Effective paraphrasing of categories (“general help desk,” “study space availability”).
-
Good grammatical range and minimal errors.
Summary of Improvements From Band 6 to Band 8
|
Aspect |
Band 6 |
Band 8 |
|
Expresses data |
Lists each figure separately |
Summarizes and compares logically |
|
Vocabulary |
Limited: liked, good, okay |
Academic: satisfied, well-rated, fell below |
|
Paragraphing |
No groupings |
Organized by logic and data features |
|
Tone |
Informal or repetitive |
Objective and formal |
By studying example answers and analyzing their differences, learners can better understand what Band 8 performance demands and how to elevate their own writing through enhanced structure, precise vocabulary, and analytical insight
IV. Common Mistakes and How to Avoid Them in Survey Descriptions
When writing about a survey chart in IELTS Writing Task 1, many candidates struggle not with understanding the data, but with presenting it clearly, accurately, and in a form that meets the IELTS assessment criteria. Survey-based tasks often involve multiple categories or groups of respondents, which can easily lead to disorganized or overly descriptive writing.
Failing to include an overview
-
Many candidates forget to write a clear general statement in the second paragraph.
-
Without an overview, your Task Achievement score will likely be limited to Band 5 or 6.
-
The overview should summarize the main trends or contrasts without using specific numbers.
-
Tip: Always highlight key insights such as the most and least popular categories and overall preferences.
Listing individual figures without grouping
-
Lower-band essays often report data point by point with no logical grouping.
-
This results in a mechanical list that lacks structure and coherence.
-
It shows surface-level understanding rather than analytical thinking.
-
Tip: Group similar items together and present overall patterns, not isolated numbers.
Mixing overview and details in one paragraph
-
Some candidates blend general trends with exact figures in the same paragraph.
-
This causes confusion and weakens the coherence of the essay.
-
It makes it hard for the reader to distinguish between summary and details.
-
Tip: Write a clear overview first, then present evidence in the body paragraphs.
Using informal or vague language
-
Informal expressions such as “a lot,” “liked it most,” or “kind of good” reduce your academic tone.
-
Vague language fails to reflect the precision required in IELTS writing.
-
Tip: Use formal, topic-specific vocabulary like “a significant majority,” “least preferred,” or “received the highest satisfaction rating.”
Ignoring meaningful comparisons
-
Candidates often write about each item separately without comparing them.
-
This eliminates opportunities to show depth of analysis and reduces Cohesion and Coherence.
-
Tip: Use comparative structures such as “more than,” “higher than,” “in contrast,” or “whereas” to show relationships between data points.
Using the wrong tense or limited grammar
-
Using the past tense or not varying your sentence structure results in a limited grammatical range.
-
Most survey charts in Task 1 should be described in the present simple tense.
-
Simple, repetitive sentence types can lower your Grammatical Range and Accuracy score.
-
Tip: Use a mix of complex and comparative structures. Stick to present tense unless the data explicitly refers to the past.
By avoiding these common pitfalls, you can improve both the clarity and the academic quality of your survey-based Task 1 writing. A strong response demonstrates your ability to describe patterns clearly, compare data meaningfully, and present information in a logical, well-structured way.
-
Applying these techniques consistently will help learners improve IELTS Writing and Reading skills across different academic task types.
Above is the full article by PREP on how to describe survey results in IELTS Writing Task 1, using data from a university library as a typical example. We hope this guide helps you understand how to organize your ideas clearly, highlight key trends, and write with more confidence and accuracy. Keep practicing with PREP to build strong writing skills—step by step.

Hi I'm Chloe, and I am currently serving as an Product Content Administrator at Prep Education. With over five years of experience in independent online IELTS study and exam preparation, I am confident in my ability to support learners in achieving their highest possible scores.
Comment
Premium content
View all


Personalized roadmap


Most read


UEN: 202227322W
Address: 114 LAVENDER STREET, #11-83 CT HUB 2, SINGAPORE (338729)

